
Image
|
Figure Caption
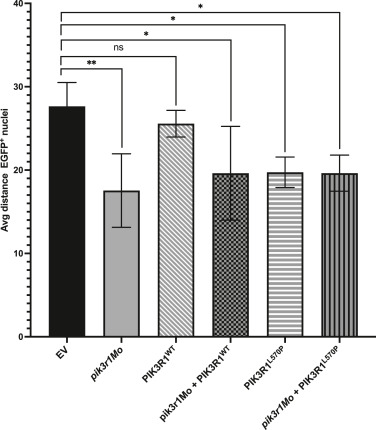
Fig. Supp 3 Measurement of the average distance between neighboring nuclei to assess cell size. In morphant as well as in mutant fish, cell size was significantly reduced compared with that in EV-injected control fish. This was not the case for overexpressing PIK3R1WT, which were not significantly smaller than EV-injected fish. EV, empty vector; ns, not significant.
Acknowledgments
This image is the copyrighted work of the attributed author or publisher, and
ZFIN has permission only to display this image to its users.
Additional permissions should be obtained from the applicable author or publisher of the image.
Full text @ J. Invest. Dermatol.