FIGURE SUMMARY
Title

Importin 13-dependent axon diameter growth regulates conduction speeds along myelinated CNS axons

Authors
Bin, J.M., Suminaite, D., Benito-Kwiecinski, S.K., Kegel, L., Rubio-Brotons, M., Early, J.J., Soong, D., Livesey, M.R., Poole, R.J., Lyons, D.A.
Source
Full text @ Nat. Commun.

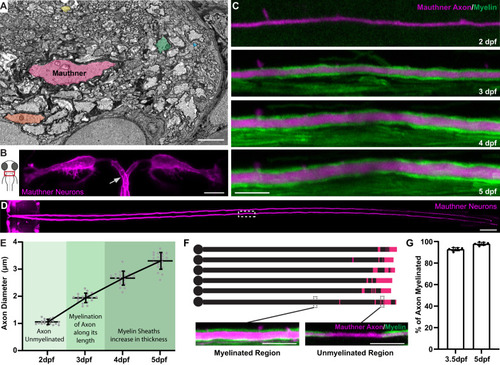
Zebrafish as a model to study axon diameter.

A Electron micrograph of a cross-section of the zebrafish ventral spinal cord at 5 dpf showing the diverse range of axon diameters. Five axons spanning the range of diameters are highlighted: the largest myelinated Mauthner axon (pink), two other myelinated axons (orange and green) and two unmyelinated axons (yellow and blue). B Schematic dorsal view of the larval zebrafish head with inset indicating the position of Mauthner neurons shown in right, labelled using the transgenic line Tg(hspGFF62A:Gal4); Tg(UAS:mem-Scarlet). The arrow points to one of the two axons, about to cross the midline. The image was obtained at 5 dpf. C Super-resolution confocal live-imaging time-course depicting the growth in diameter of a Mauthner axon (magenta—Tg(hspGFF62A:Gal4); Tg(UAS:mRFP)) with myelination (green—Tg(mbp:eGFP-CAAX)) at somite 15 from 2 to 5 dpf. D Tiled dorsal view of the Mauthner neurons (5 dpf), labelled using the transgenic line Tg(hspGFF62A:Gal4); Tg(UAS:mRFP). White boxed region depicts where the time course analysis in C was performed (somite 15). E Quantification of Mauthner axon diameter growth with relation to its myelination followed for the same axons over time at somite 15 from 2 to 5 dpf (n = 19 axons from individual animals). This dataset is the same as the wild-type data shown in Fig. 3B. F Schematic of the myelination of six different wild-type Mauthner axons at 3.5 dpf, with myelinated regions represented by black and unmyelinated regions represented by magenta, which is quantified in (G). Insets show a myelinated and unmyelinated region of the axon with the axon labelled using the transgenic lines Tg(hspGFF62A:Gal4); Tg(UAS:mRFP) and myelin labelled using the transgenic line Tg(mbp:eGFP-CAAX). G Quantification of the percentage of the Mauthner axon myelinated at 3.5 dpf and 5 dpf (n = 6 axons from individual animals). All graphs are presented as mean values ± SD, with repeated measures for the same axon at each time point. Scale bars: 1 µm (A), 10 µm (B, C, F), 100 µm (D). Source data are provided as a Source Data file.

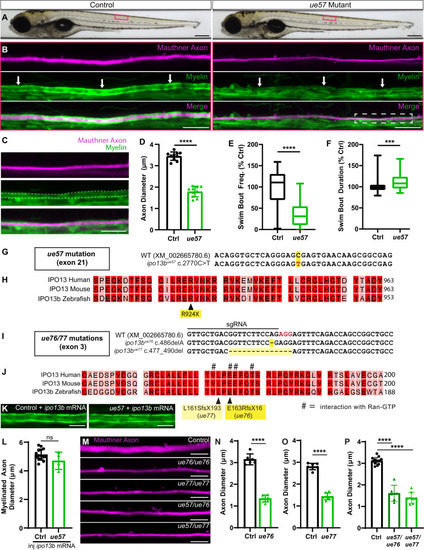
Identification of importin 13b mutants with reduced axon diameter growth.

A Brightfield images of control and ue57 mutant zebrafish at 5 dpf, depicting normal growth and gross morphology. B The Mauthner axon (somite 15) labelled using Tg(hspGFF62A:Gal4); Tg(UAS:mRFP) in control (left panels) and ue57 mutant (right panels) is of smaller diameter in mutants at 5 dpf. Labelling of myelin with Tg(mbp:eGFP-CAAX) shows that the Mauthner axon is myelinated (white arrows). Magnification of the mutant Mauthner axon (region within the dashed rectangle) is shown in (C) with the myelin along the Mauthner axon outlined with dashed lines. D Mauthner axon diameter measured at somite 15 using the Tg(hspGFF62A:Gal4); Tg(UAS:mRFP) reporter at 5 dpf (two-tailed unpaired t-test, n = 10 axons from individual animals per genotype, p < 0.0001). E In a 20 min open field test at 5 dpf, ue57 mutant zebrafish initiate fewer swim bouts than controls; however, swim bouts are slightly longer in length (F) (two-tailed Mann–Whitney test, p < 0.0001 for (E) and p = 0.001 for (F), n = 144 control and 31 ue57 animals). G A region of exon 21 (last exon) of the ipo13b gene where a C > T base pair change (highlighted in red) was identified in ue57 mutants. H This base pair change results in the introduction of a premature stop codon in the highly conserved C-terminal region of importin 13b, predicted to result in a truncated protein missing the last 30 amino acids. I Overview of a region in exon 3 of the ipo13b gene indicating the site targeted with a sgRNA for Cas9-mediated DNA cleavage (PAM sequence highlighted in red), and the resulting mutations in the ue76 and ue77 mutant lines. J The mutations disrupt key residues previously shown to bind Ran-GTP (marked with #)57, and result in frame shifts followed by premature stop codons. K Representative images of the myelinated Mauthner axon (somite 15, 5 dpf) labelled using Tg(mbp:eGFP-CAAX) in control and ue57 zebrafish that were injected with 125 pg of ipo13b mRNA at the single cell stage, with quantification in (L) showing rescue of the axon diameter phenotype (two-tailed unpaired t-test, n = 15 control and 4 ue57 axons from individual animals, p = 0.096). M Representative images of the Mauthner axon (somite 15) labelled using the Tg(hspGFF62A:Gal4); Tg(UAS:GFP) reporter in 4–5 dpf control, ipo13bue76, ipo13bue77,ipo13bue57/ue77, ipo13bue57/ue77 zebrafish, with quantification of axon diameter compared to control siblings shown in (NP) (N—two-tailed unpaired t-test, n = 6 axons from individual animals per genotype, p < 0.0001; O—two-tailed unpaired t-test, n = 7 axons from individual animals per genotype, p < 0.0001, P—One-way ANOVA with Tukey’s multiple comparisons test, n = 15 control, 6 ue57/ue76, and 8 ue57/ue77 axons from individual animals, p < 0.0001)). Data are presented as mean values ± SD, except E and F where data is presented as box and whisker plots with boxes indicating the median, 25th and 75th percentiles, and whiskers indicating the max and min. ***p < 0.001, ****p < 0.0001, ns = not significant. Scale bars: 300 µm (A), 20 µm (B), 10 µm (C, K, M). Source data are provided as a Source Data file.

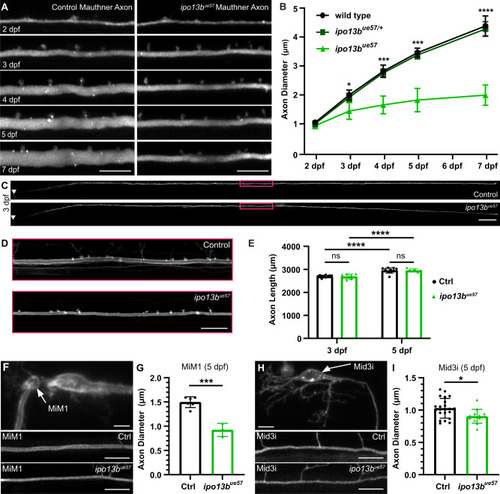
Live-imaging of axon diameter growth defects in importin 13b mutants.

A Representative live-imaging time course of the Mauthner axon (somite 15) from 2 to 7 dpf in a control and ipo13bue57 zebrafish labelled using Tg(hspGFF62A:Gal4); Tg(UAS:GFP). B Quantification of Mauthner axon diameter growth followed for the same axons at somite 15 from 2 to 7 dpf (2-way RM ANOVA with Tukey’s multiple comparisons test, n = 19 wild type, 33 heterozygous, 6 mutant axons from individual animals with repeated measures at each time point, p = 0.016 (3dpf), p = 0.0003 (4dpf), p = 0.0002 (5dpf), p < 0.0001 (7dpf) for wild type vs. mutant comparisons, wild type vs. heterozygous are not significantly different from one another). C Representative live images of the entire Mauthner neuron in control and ipo13bue57zebrafish at 3 dpf labelled using Tg(hspGFF62A:Gal4); Tg(UAS:mem-Scarlet), which were used to measure axon length in (E). Area boxed in magenta is enlarged in (D). E Quantification of the entire length of the Mauthner axon at 3 and 5 dpf (two-way RM ANOVA with Uncorrected Fisher’s LSD, n = 10 control and 7 ipo13bue57 axons from individual animals with repeated measures at each time point, p > 0.0001 for 3 dpf vs. 5 dpf comparisons, no significant differences between genotypes at 3 dpf (p = 0.842) or 5 dpf (p = 0.996)). F MiM1 and (H) Mid3i neurons (arrows in top panels) and their axons (somite 15, 5 dpf) in control (middle panels) and ipo13bue57 (bottom panels) animals labelled using the transgenic reporter Tg(hspGFF62A:Gal4); Tg(UAS:mem-Scarlet). G Quantification of MiM1 axon diameter at 5 dpf (two-tailed unpaired t-test, n = 6 control and 3 ipo13bue57 axons from individual animals, p = 0.0003). I Quantification of Mid3i axon diameter at 5 dpf (two-tailed unpaired t-test, n = 22 control and 13 ipo13bue57 axons from individual animals, p = 0.016). All data are presented as mean values ± SD. *p < 0.05, ***p < 0.001, ****p < 0.0001, ns = not significant. Scale bars: 10 µm (A, F, H), 100 µm (C), 20 µm (D). Source data are provided as a Source Data file.

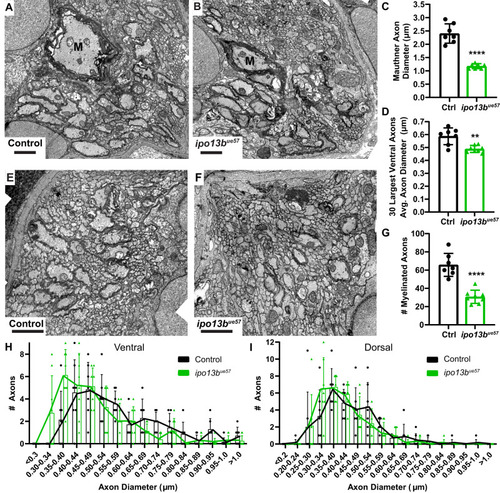
Electron microscopy of axon diameter growth defects in importin 13b mutants.

A Representative electron micrographs of cross sections of the ventral spinal cord at 7 dpf in control and Bipo13bue57 animals. The Mauthner axon is labelled ‘M’. C Quantification of Mauthner axon diameter from 7 dpf electron micrographs (two-tailed unpaired t-test with Welch’s correction, n = 7 axons from individual animals, p < 0.0001). D Mean diameter for the 30 largest axons in each hemi ventral spinal cord at 7 dpf, excluding Mauthner (two-tailed unpaired t-test with Welch’s correction, n = 7 control and 8 ipo13bue57 animals, p = 0.006). E Representative electron micrographs of cross sections of the dorsal spinal cord at 7 dpf in control and Fipo13bue57 zebrafish. G Number of myelinated axons in the dorsal and ventral tracts per hemi spinal cord at 7 dpf (two-tailed unpaired t-test, n = 7 control and 8 ipo13bue57 animals, p < 0.0001). H Distribution of axon diameters for the 30 largest axons in each hemi ventral spinal cord at 7 dpf, excluding Mauthner (n = 7 control and 8 ipo13bue57 animals). I Distribution of axon diameters for the 30 largest axons in each hemi dorsal spinal cord at 7 dpf (n = 7 control and 8 ipo13bue57 animals). All data are presented as mean values ± SD. **p < 0.01, ****p < 0.0001. Scale bars = 1 µm. Source data are provided as a Source Data file.

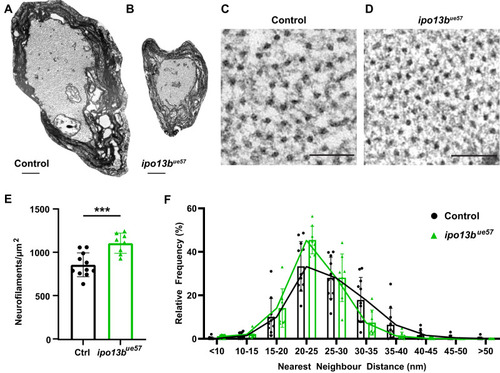
Disruption of importin 13b function increases neurofilament density in the Mauthner axon.

A, B Representative electron micrographs of a cross-section of the Mauthner axon in the ventral spinal cord at 7 dpf in control and ipo13bue57zebrafish. A region of each axon is magnified in (C) (control) and (D) (ipo13bue57) to allow visualisation of the distribution of neurofilaments. E Density of neurofilaments in control and ipo13bue57 mutant Mauthner axons at 7 dpf (two-tailed unpaired t-test, n = 11 control and 8 ipo13bue57 animals, p = 0.0007). F Nearest neighbour distribution of neurofilaments in the Mauthner axon at 7 dpf, showing a shift to closer nearest neighbours in the ipo13bue57 mutants (n = 11 control and 8 ipo13bue57 animals). Scale bars: 500 nm (A, B), 100 nm (C, D). All data are presented as mean values ± SD. ***p < 0.001. Source data are provided as a Source Data file.

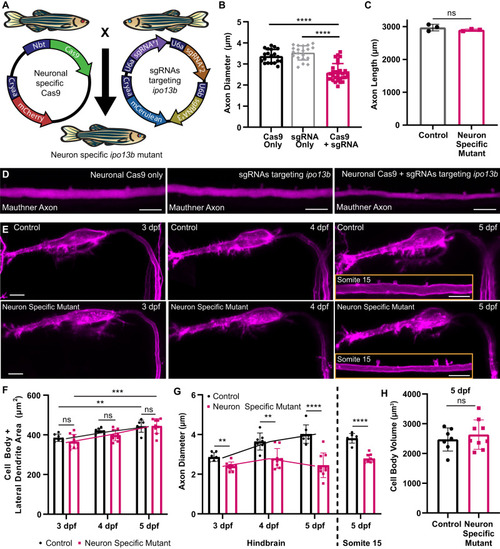
Disruption of axon diameter in neuron-specific ipo13b mutants.

A Schematic overview of the transgenic CRISPR/Cas9 strategy used to generate neuron-specific ipo13b mutants. B Quantification of Mauthner axon diameter in control (Cas9 or sgRNA only) and neuron-specific ipo13b mutants (Cas9+sgRNA) at 5 dpf (Kruskal–Wallis test with Dunn’s multiple comparisons test, n = 20 Cas9 only, 20 sgRNA only, 30 Cas9 + sgRNA axons (1–2 axons per animal), p < 0.0001). C Quantification of Mauthner axon length in control and neuron-specific ipo13b mutants at 5 dpf (two-tailed unpaired t-test, n = 3 axons from individual animals for each genotype, p = 0.2943). D Representative images of the Mauthner axon (somite 15, 5 dpf) in control and neuron-specific ipo13b mutant animals labelled using Tg(hspGFF62A:Gal4); Tg(UAS:mRFP). E Representative time course images of the Mauthner cell body, dendrites, and proximal axon in control and neuron-specific ipo13b mutants from 3 to 5 dpf labelled using Tg(hspGFF62A:Gal4); Tg(UAS:mem-Scarlet). The inset at 5 dpf shows the axon at somite 15. F Quantification of the area of the Mauthner cell body and lateral dendrite measured for the same neurons from 3 to 5 dpf (two way RM ANOVA with Tukey’s multiple comparisons tests, n = 7 control and 9 neuron-specific mutant Mauthner cells from individual animals with repeated measures at each time point, p = 0.003 (control 3 dpf vs. 5 dpf) and p = 0.0004 (neuron-specific mutant 3 dpf vs 5 dpf); control vs. neuron-specific mutants are not significant at any time points p = 0.1834 (3 dpf), p = 0.0504 (4 dpf) and p = 0.9443 (5 dpf)). G Quantification of Mauthner axon diameter (proximal region of the axon located in the hindbrain) measured from 3 to 5 dpf for the same neurons as in (F) (two-way RM ANOVA with Tukey’s multiple comparisons tests, n = 7 control and 9 neuron-specific mutant Mauthner cells from individual animals with repeated measures at each time point, p = 0.0010 (3 dpf), p = 0.0026 (4 dpf), and p < 0.0001 (5 dpf)). Measurements of axon diameter at somite 15 for the same axons are also shown for the 5 dpf time point (two-tailed unpaired t-test, n = 7 control and 9 neuron-specific mutant Mauthner cells from individual animals, p < 0.0001). H Quantification of the volume of the Mauthner cell body at 5 dpf (two-tailed unpaired t-test, n = 7 control and 9 neuron-specific mutant Mauthner cells from individual animals, p = 0.482). All data are presented as mean values ± SD. **p < 0.01, ***p < 0.001, ****p < 0.0001, ns = not significant. Scale bars = 10 µm. Source data are provided as a Source Data file.

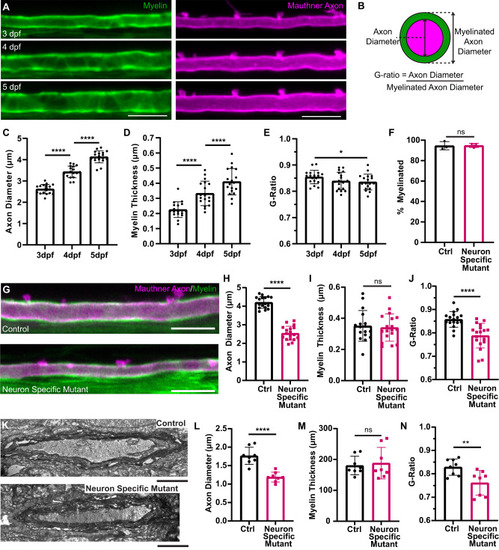
Reduced axon diameter growth does not change myelin thickness along the Mauthner axon.

A Representative time course from 3 to 5 dpf depicting the growth in diameter of a Mauthner axon (magenta—Tg(hspGFF62A:Gal4); Tg(UAS:mem-Scarlet)) and growth of myelin in thickness (green—Tg(mbp:eGFP-CAAX)) at somite 15. B Schematic representation of how the g-ratio for an axon is calculated. CE Quantification of axon diameter (C), myelin thickness (D) and g-ratio (E) for control Mauthner axons followed from 3 to 5 dpf (RM one-way ANOVA with Tukey’s multiple comparison test, n = 18 axons from individual animals with repeated measures at each time point. p < 0.0001 for (C) (3 dpf vs. 4 dpf and 4 dpf vs. 5 dpf), p < 0.0001 for (D) (3 dpf vs. 4 dpf and 4 dpf vs. 5 dpf), and p = 0.0394 for (E) (3 dpf vs. 5 dpf). F Quantification of the percentage of the Mauthner axon myelinated at 5 dpf (two-tailed unpaired t-test, n = 3 axons from individual animals for each genotype, p = 0.9239). G Representative images of the Mauthner axon and its myelin in control and neuron-specific ipo13b mutants at 5 dpf labelled using the transgenic lines Tg(hspGFF62A:Gal4); Tg(UAS:mem-Scarlet; Tg(mbp:eGFP-CAAX). HJ Quantification of axon diameter (H), myelin thickness (I) and g-ratio (J) for control and neuron-specific ipo13b mutant Mauthner axons at 5 dpf at somite 15 (two-tailed unpaired t-tests, n = 17 control and 18 neuron-specific mutant axons from individual animals, p < 0.0001 (H), p = 0.7333 (I), and p < 0.0001 (J)). K Representative electron micrographs of the Mauthner axon in control and neuron-specific ipo13b mutant Mauthner axons at 5 dpf at somite 15–16. L–N Quantification from electron micrographs of axon diameter (L), myelin thickness (M) and g-ratio (N) for control and neuron-specific ipo13b mutant Mauthner axons at 5 dpf at somite 15–16 (two-tailed unpaired t-tests, n = 8 control and 8 neuron-specific mutant animals, p < 0.0001 (L), p = 0.7167 (M), p = 0.0093 (N)). All data are presented as mean values ± SD. *p < 0.05, **p < 0.01, ****p < 0.0001, ns = not significant. Scale bars: 10 µm (A, G), 1 µm (K). Source data are provided as a Source Data file.

Diameter growth drives changes to conduction speeds along myelinated axons over time.

A Schematic overview of the electrophysiological set-up for measuring conduction velocity along the Mauthner axon. B Representative super-resolution confocal images of Mauthner axons labelled using the transgenic line Tg(hspGFF62A:Gal4); Tg(UAS:mRFP) alongside whole-cell patch clamp traces showing action potentials generated in response to extracellular stimulation of the same axons (C). D Axon diameter measurements for Mauthner axons at 5 dpf at somite 15 in neuron-specific ipo13b mutant animals and control siblings (two-tailed unpaired t-test with Welch’s correction, n = 8 control and 10 neuron-specific mutant axons from individual animals, p < 0.0001). E Conduction velocity measurements for the same axons as in (D) (two-tailed unpaired t-test with Welch’s correction, n = 8 control and 10 neuron-specific mutant axons from individual animals, p < 0.0001). F Conduction velocity along Mauthner axon plotted against axon diameter for control axons (3–5 dpf, n = 18 animals) and neuron-specific ipo13b mutant axons (5 dpf, n = 10 animals). Control points are fitted with a linear regression line (R = 0.4959). Neuron-specific ipo13b mutants are not significantly different from controls by simple linear regression test (slope: p = 0.5931, intercepts: p = 0.6215). G Resting membrane potential in control and neuron-specific ipo13b mutant Mauthner neurons at 5 dpf (two-tailed unpaired t-test, n = 12 control and 10 neuron-specific ipo13b mutant Mauthner cells from individual animals, p = 0.2581). H The success rate of action potential firing by the Mauthner neuron in response to 10 stimulations at 300 Hz, 500 Hz and 1000 Hz (two-way RM ANOVA with Tukey’s multiple comparisons tests, n = 5 control 3 dpf, 5 control 4 dpf, 8 control 5 dpf, 10 neuron-specific mutant 5 dpf axons from individual animals with repeated measures at each frequency, no significant differences between the controls of different ages, or between any of the controls and neuron-specific ipo13b mutants, p = 0.9667). I Depiction of three consecutive action potentials, which have slight variations in their latency of arrival. This variation is referred to as jitter. J The precision of action potential arrival (jitter) along Mauthner axon (One-way ANOVA with Tukey’s multiple comparisons test, n = 5 control 3 dpf, 5 control 4 dpf, 8 control 5dpf, 10 neuron-specific mutant 5 dpf axons from individual animals, p = 0.2699). Scale bars = 10 µm. All data are presented as mean values ± SD. ****p < 0.0001. Source data are provided as a Source Data file.

Acknowledgments
This image is the copyrighted work of the attributed author or publisher, and ZFIN has permission only to display this image to its users. Additional permissions should be obtained from the applicable author or publisher of the image. Full text @ Nat. Commun.