IMAGE

Fig. 1

ID
ZDB-IMAGE-240229-184
Source
Figures for Bin et al., 2024
Image
Figure Caption

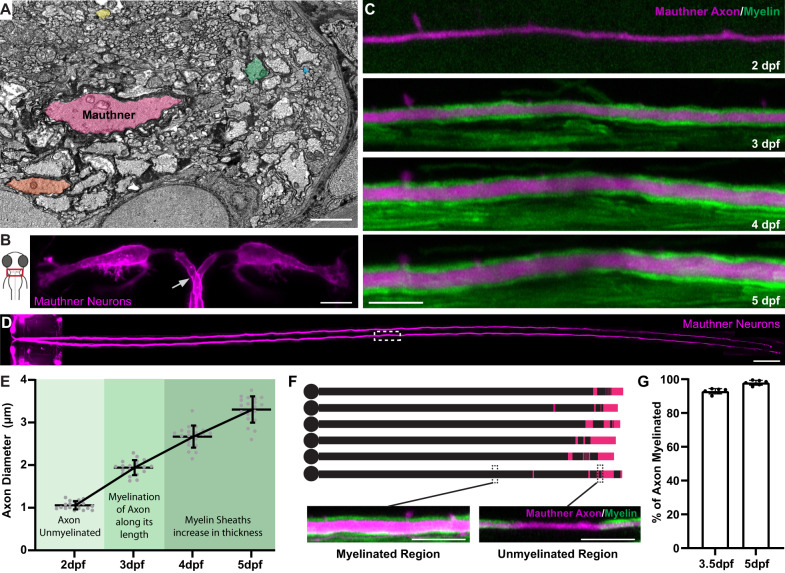
Fig. 1 Zebrafish as a model to study axon diameter.

A Electron micrograph of a cross-section of the zebrafish ventral spinal cord at 5 dpf showing the diverse range of axon diameters. Five axons spanning the range of diameters are highlighted: the largest myelinated Mauthner axon (pink), two other myelinated axons (orange and green) and two unmyelinated axons (yellow and blue). B Schematic dorsal view of the larval zebrafish head with inset indicating the position of Mauthner neurons shown in right, labelled using the transgenic line Tg(hspGFF62A:Gal4); Tg(UAS:mem-Scarlet). The arrow points to one of the two axons, about to cross the midline. The image was obtained at 5 dpf. C Super-resolution confocal live-imaging time-course depicting the growth in diameter of a Mauthner axon (magenta—Tg(hspGFF62A:Gal4); Tg(UAS:mRFP)) with myelination (green—Tg(mbp:eGFP-CAAX)) at somite 15 from 2 to 5 dpf. D Tiled dorsal view of the Mauthner neurons (5 dpf), labelled using the transgenic line Tg(hspGFF62A:Gal4); Tg(UAS:mRFP). White boxed region depicts where the time course analysis in C was performed (somite 15). E Quantification of Mauthner axon diameter growth with relation to its myelination followed for the same axons over time at somite 15 from 2 to 5 dpf (n = 19 axons from individual animals). This dataset is the same as the wild-type data shown in Fig. 3B. F Schematic of the myelination of six different wild-type Mauthner axons at 3.5 dpf, with myelinated regions represented by black and unmyelinated regions represented by magenta, which is quantified in (G). Insets show a myelinated and unmyelinated region of the axon with the axon labelled using the transgenic lines Tg(hspGFF62A:Gal4); Tg(UAS:mRFP) and myelin labelled using the transgenic line Tg(mbp:eGFP-CAAX). G Quantification of the percentage of the Mauthner axon myelinated at 3.5 dpf and 5 dpf (n = 6 axons from individual animals). All graphs are presented as mean values ± SD, with repeated measures for the same axon at each time point. Scale bars: 1 µm (A), 10 µm (B, C, F), 100 µm (D). Source data are provided as a Source Data file.

Acknowledgments
This image is the copyrighted work of the attributed author or publisher, and ZFIN has permission only to display this image to its users. Additional permissions should be obtained from the applicable author or publisher of the image. Full text @ Nat. Commun.