|
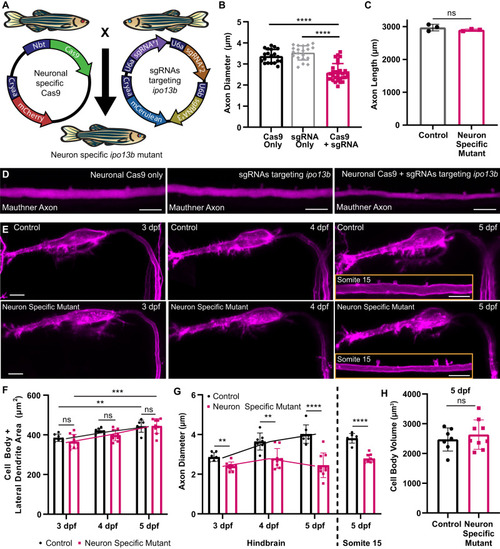
Disruption of axon diameter in neuron-specific ipo13b mutants. A Schematic overview of the transgenic CRISPR/Cas9 strategy used to generate neuron-specific ipo13b mutants. B Quantification of Mauthner axon diameter in control (Cas9 or sgRNA only) and neuron-specific ipo13b mutants (Cas9+sgRNA) at 5 dpf (Kruskal–Wallis test with Dunn’s multiple comparisons test, n = 20 Cas9 only, 20 sgRNA only, 30 Cas9 + sgRNA axons (1–2 axons per animal), p < 0.0001). C Quantification of Mauthner axon length in control and neuron-specific ipo13b mutants at 5 dpf (two-tailed unpaired t-test, n = 3 axons from individual animals for each genotype, p = 0.2943). D Representative images of the Mauthner axon (somite 15, 5 dpf) in control and neuron-specific ipo13b mutant animals labelled using Tg(hspGFF62A:Gal4); Tg(UAS:mRFP). E Representative time course images of the Mauthner cell body, dendrites, and proximal axon in control and neuron-specific ipo13b mutants from 3 to 5 dpf labelled using Tg(hspGFF62A:Gal4); Tg(UAS:mem-Scarlet). The inset at 5 dpf shows the axon at somite 15. F Quantification of the area of the Mauthner cell body and lateral dendrite measured for the same neurons from 3 to 5 dpf (two way RM ANOVA with Tukey’s multiple comparisons tests, n = 7 control and 9 neuron-specific mutant Mauthner cells from individual animals with repeated measures at each time point, p = 0.003 (control 3 dpf vs. 5 dpf) and p = 0.0004 (neuron-specific mutant 3 dpf vs 5 dpf); control vs. neuron-specific mutants are not significant at any time points p = 0.1834 (3 dpf), p = 0.0504 (4 dpf) and p = 0.9443 (5 dpf)). G Quantification of Mauthner axon diameter (proximal region of the axon located in the hindbrain) measured from 3 to 5 dpf for the same neurons as in (F) (two-way RM ANOVA with Tukey’s multiple comparisons tests, n = 7 control and 9 neuron-specific mutant Mauthner cells from individual animals with repeated measures at each time point, p = 0.0010 (3 dpf), p = 0.0026 (4 dpf), and p < 0.0001 (5 dpf)). Measurements of axon diameter at somite 15 for the same axons are also shown for the 5 dpf time point (two-tailed unpaired t-test, n = 7 control and 9 neuron-specific mutant Mauthner cells from individual animals, p < 0.0001). H Quantification of the volume of the Mauthner cell body at 5 dpf (two-tailed unpaired t-test, n = 7 control and 9 neuron-specific mutant Mauthner cells from individual animals, p = 0.482). All data are presented as mean values ± SD. **p < 0.01, ***p < 0.001, ****p < 0.0001, ns = not significant. Scale bars = 10 µm. Source data are provided as a Source Data file.
|