IMAGE

Fig. 4

ID
ZDB-IMAGE-240229-186
Source
Figures for Bin et al., 2024
Image
Figure Caption

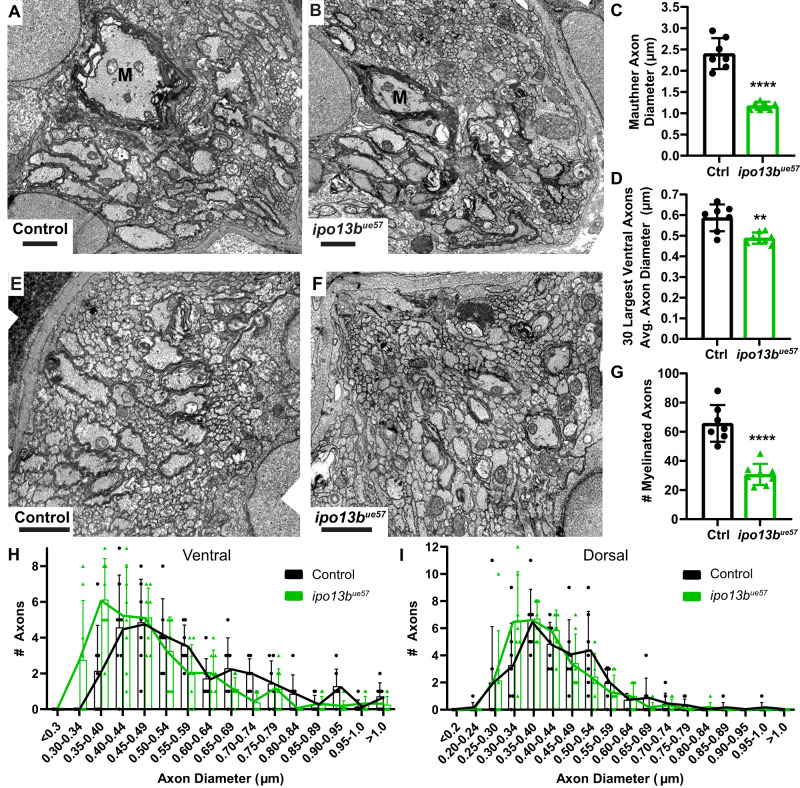
Fig. 4 Electron microscopy of axon diameter growth defects in importin 13b mutants.

A Representative electron micrographs of cross sections of the ventral spinal cord at 7 dpf in control and Bipo13bue57 animals. The Mauthner axon is labelled ‘M’. C Quantification of Mauthner axon diameter from 7 dpf electron micrographs (two-tailed unpaired t-test with Welch’s correction, n = 7 axons from individual animals, p < 0.0001). D Mean diameter for the 30 largest axons in each hemi ventral spinal cord at 7 dpf, excluding Mauthner (two-tailed unpaired t-test with Welch’s correction, n = 7 control and 8 ipo13bue57 animals, p = 0.006). E Representative electron micrographs of cross sections of the dorsal spinal cord at 7 dpf in control and Fipo13bue57 zebrafish. G Number of myelinated axons in the dorsal and ventral tracts per hemi spinal cord at 7 dpf (two-tailed unpaired t-test, n = 7 control and 8 ipo13bue57 animals, p < 0.0001). H Distribution of axon diameters for the 30 largest axons in each hemi ventral spinal cord at 7 dpf, excluding Mauthner (n = 7 control and 8 ipo13bue57 animals). I Distribution of axon diameters for the 30 largest axons in each hemi dorsal spinal cord at 7 dpf (n = 7 control and 8 ipo13bue57 animals). All data are presented as mean values ± SD. **p < 0.01, ****p < 0.0001. Scale bars = 1 µm. Source data are provided as a Source Data file.

Acknowledgments
This image is the copyrighted work of the attributed author or publisher, and ZFIN has permission only to display this image to its users. Additional permissions should be obtained from the applicable author or publisher of the image. Full text @ Nat. Commun.