|
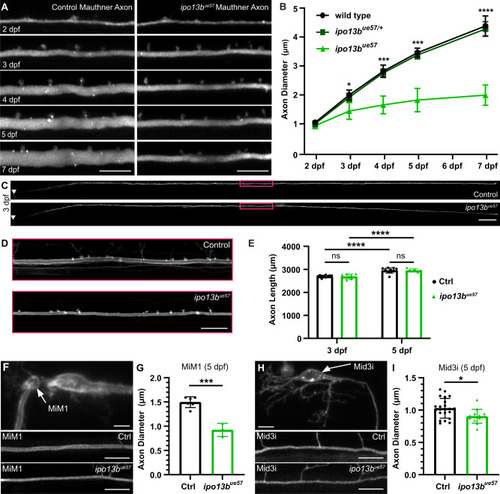
Live-imaging of axon diameter growth defects in importin 13b mutants. A Representative live-imaging time course of the Mauthner axon (somite 15) from 2 to 7 dpf in a control and ipo13bue57 zebrafish labelled using Tg(hspGFF62A:Gal4); Tg(UAS:GFP). B Quantification of Mauthner axon diameter growth followed for the same axons at somite 15 from 2 to 7 dpf (2-way RM ANOVA with Tukey’s multiple comparisons test, n = 19 wild type, 33 heterozygous, 6 mutant axons from individual animals with repeated measures at each time point, p = 0.016 (3dpf), p = 0.0003 (4dpf), p = 0.0002 (5dpf), p < 0.0001 (7dpf) for wild type vs. mutant comparisons, wild type vs. heterozygous are not significantly different from one another). C Representative live images of the entire Mauthner neuron in control and ipo13bue57zebrafish at 3 dpf labelled using Tg(hspGFF62A:Gal4); Tg(UAS:mem-Scarlet), which were used to measure axon length in (E). Area boxed in magenta is enlarged in (D). E Quantification of the entire length of the Mauthner axon at 3 and 5 dpf (two-way RM ANOVA with Uncorrected Fisher’s LSD, n = 10 control and 7 ipo13bue57 axons from individual animals with repeated measures at each time point, p > 0.0001 for 3 dpf vs. 5 dpf comparisons, no significant differences between genotypes at 3 dpf (p = 0.842) or 5 dpf (p = 0.996)). F MiM1 and (H) Mid3i neurons (arrows in top panels) and their axons (somite 15, 5 dpf) in control (middle panels) and ipo13bue57 (bottom panels) animals labelled using the transgenic reporter Tg(hspGFF62A:Gal4); Tg(UAS:mem-Scarlet). G Quantification of MiM1 axon diameter at 5 dpf (two-tailed unpaired t-test, n = 6 control and 3 ipo13bue57 axons from individual animals, p = 0.0003). I Quantification of Mid3i axon diameter at 5 dpf (two-tailed unpaired t-test, n = 22 control and 13 ipo13bue57 axons from individual animals, p = 0.016). All data are presented as mean values ± SD. *p < 0.05, ***p < 0.001, ****p < 0.0001, ns = not significant. Scale bars: 10 µm (A, F, H), 100 µm (C), 20 µm (D). Source data are provided as a Source Data file.
|