|
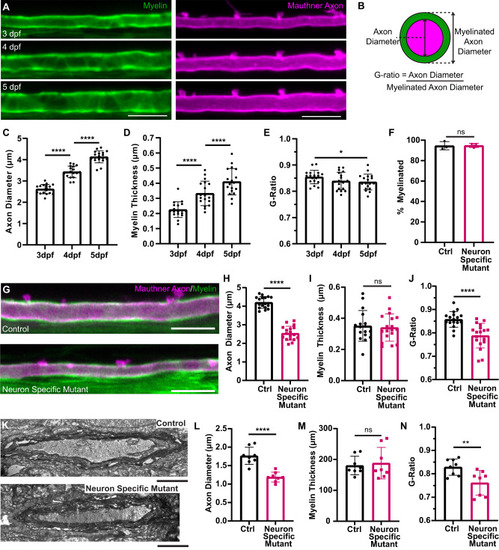
Reduced axon diameter growth does not change myelin thickness along the Mauthner axon. A Representative time course from 3 to 5 dpf depicting the growth in diameter of a Mauthner axon (magenta—Tg(hspGFF62A:Gal4); Tg(UAS:mem-Scarlet)) and growth of myelin in thickness (green—Tg(mbp:eGFP-CAAX)) at somite 15. B Schematic representation of how the g-ratio for an axon is calculated. C–E Quantification of axon diameter (C), myelin thickness (D) and g-ratio (E) for control Mauthner axons followed from 3 to 5 dpf (RM one-way ANOVA with Tukey’s multiple comparison test, n = 18 axons from individual animals with repeated measures at each time point. p < 0.0001 for (C) (3 dpf vs. 4 dpf and 4 dpf vs. 5 dpf), p < 0.0001 for (D) (3 dpf vs. 4 dpf and 4 dpf vs. 5 dpf), and p = 0.0394 for (E) (3 dpf vs. 5 dpf). F Quantification of the percentage of the Mauthner axon myelinated at 5 dpf (two-tailed unpaired t-test, n = 3 axons from individual animals for each genotype, p = 0.9239). G Representative images of the Mauthner axon and its myelin in control and neuron-specific ipo13b mutants at 5 dpf labelled using the transgenic lines Tg(hspGFF62A:Gal4); Tg(UAS:mem-Scarlet; Tg(mbp:eGFP-CAAX). H–J Quantification of axon diameter (H), myelin thickness (I) and g-ratio (J) for control and neuron-specific ipo13b mutant Mauthner axons at 5 dpf at somite 15 (two-tailed unpaired t-tests, n = 17 control and 18 neuron-specific mutant axons from individual animals, p < 0.0001 (H), p = 0.7333 (I), and p < 0.0001 (J)). K Representative electron micrographs of the Mauthner axon in control and neuron-specific ipo13b mutant Mauthner axons at 5 dpf at somite 15–16. L–N Quantification from electron micrographs of axon diameter (L), myelin thickness (M) and g-ratio (N) for control and neuron-specific ipo13b mutant Mauthner axons at 5 dpf at somite 15–16 (two-tailed unpaired t-tests, n = 8 control and 8 neuron-specific mutant animals, p < 0.0001 (L), p = 0.7167 (M), p = 0.0093 (N)). All data are presented as mean values ± SD. *p < 0.05, **p < 0.01, ****p < 0.0001, ns = not significant. Scale bars: 10 µm (A, G), 1 µm (K). Source data are provided as a Source Data file.
|