FIGURE SUMMARY
Title

Elovl4b Knockout Zebrafish as a Model for Ocular Very-Long-Chain Polyunsaturated Fatty Acid Deficiency

Authors
Nwagbo, U., Parvez, S., Maschek, J.A., Bernstein, P.S.
Source
Full text @ J. Lipid Res.

VLC-PUFA biosynthetic pathways in mammals and zebrafish. Comparison of the VLC-PUFA biosynthetic pathways from linoleic (18:2n-6) and α-linolenic (18:3n-3) acid precursors of zebrafish and mammalian vertebrates (adapted from Refs. (10) and (13)). Large dashed black arrows represent the desaturation steps, small dashed arrows represent the β-oxidation steps, and solid arrows represent the elongation steps. AA, arachidonic acid; ALA, α-linolenic acid; LA, linoleic acid. Color key: red text: mammalian (human and murine) orthologues, blue text: zebrafish orthologues, and brown text and arrows: pathway presumed but not confirmed in zebrafish.

Sequencing and PCR analysis. A: Gel electrophoresis showing wild-type, heterozygous, and homozygous Elovl4b KO zebrafish. DNA was extracted from caudal fin clips and amplified using PCR. The PCR product was subsequently run on 2% agarose gel at 110 V. This image was captured using an iBright CL750 imaging system (Invitrogen, Carlsbad, CA). B: Nucleotide sequence alignment between wild-type and homozygous Elovl4b mutant fish shows that a 56 bp deletion mutation at exon 2 of zebrafish Elolv4b leads to a premature termination codon at position 5 of the protein-coding sequence. The start codons are highlighted in yellow, and the premature termination codon is highlighted in green.

RT-PCR analysis of brain and ocular tissue from Elovl4b KO fish. Gel electrophoresis of RT-PCR products at their expected molecular weight. Elovl4b expression is reduced in brain and retina lysates in heterozygous and homozygous Elovl4b KO fish compared with WT controls.

EXPRESSION / LABELING:
Gene:
Fish:
Anatomical Terms:
Stage: Adult
PHENOTYPE:
Fish:
Observed In:
Stage: Adult

Lipid profile of C24-C36 N-3 and N-6 VLC-PUFAs in Elovl4b+/− (blue), Elovl4b−/− (orange), and wild-type Elovl4b+/+ (gray) zebrafish eyes. A: C24-C36, (B) C26, (C) C28, (D) C30, (E) C32, (F) C34, and (G) C36 n-3 and n-6 PUFAs. VLC-PUFA analysis was done using gas chromatography and mass spectrometry. Elovl4b+/−n = 3, Elovl4b−/−n = 3, and Elovl4b+/+n = 2. Lipid peak areas were normalized to the internal standard. Error bars represent the standard error of the mean. P values between groups were obtained using a one-tailed t-test with unequal variance. ∗P ≤ 0.05, ∗∗P ≤ 0.01, and ∗∗∗P ≤ 0.001.

Volcano and box plot analyses of ocular lipid profiles of male Elovl4b KO and WT zebrafish normalized to tissue weight using a one-way ANOVA test. Volcano plot shows that seven compounds were significantly downregulated, whereas three compounds were significantly upregulated in ocular lipid comparisons between homozygous Elovl4b KO fish and WT age- and sex-matched controls (n ≥ 4 each). Blue dots represent significantly downregulated lipid species; red dots represent significantly upregulated lipid species; and gray dots represent lipid groups that were not significant in the comparison using our parameters. VLC-PUFA-containing species are circled in volcano plot comparisons. The box plots show the relative peak intensities of significantly altered lipids. Male WT (WT-M; orange) and homozygous Elovl4b KO fish (KO-M; dark purple) (n ≥ 4 each). The y-axes represent the relative peak intensities obtained through LC-MS/MS analysis. Significance was determined using the following parameters: P < 0.05, fold change >1.5, and false discovery rate adjusted.

Volcano and box plot analyses of ocular lipid profiles of female Elovl4b KO and WT zebrafish normalized to tissue weight using a one-way ANOVA test. Volcano plot analysis showing two compounds significantly downregulated in female homozygous Elovl4b KO fish compared with WT age- and sex-matched controls (n = 3 each). Blue dots represent significantly downregulated lipid species; and gray dots represent lipid groups that were not significant in the comparison using our parameters. VLC-PUFA-containing species are circled in volcano plot comparisons. The box plots show the relative peak intensities of significantly altered lipids. Female WT (WT-F; teal green) and homozygous Elovl4b KO fish (KO-F; tan brown) (n = 3 each). The y-axes represent the relative peak intensities obtained through LC-MS/MS analysis. Significance was determined using the following parameters: P < 0.05, fold change >1.5, and false discovery rate adjusted.

Gross histology and ORO stain. Toluidine blue-stained retinal sections of 1-year-old wild-type and homozygous Elovl4b KO fish. We observed no significant differences in the gross morphology and lamination of the retinas from both groups. Images were taken at 4× (A) and 40× (B) magnification. Cryosections of 1-year-old age-matched male wild-type and homozygous Elovl4b KO zebrafish retinas, treated with ORO to stain lipids (red) and counterstained with hematoxylin (blue) (C). The red arrows point to lipid-rich ORO-stained puncta localizing in the basal RPE of homozygous Elovl4b KO mutants. Images were taken at 40× with a Zeiss AxioScan slide scanner. GCL, retinal ganglion cell layer; INL, inner nuclear layer; IPL, inner plexiform layer; IS, inner segment; ONL, outer nuclear layer; OPL, outer plexiform layer; OS, outer segment; RPE, retinal pigment epithelium.

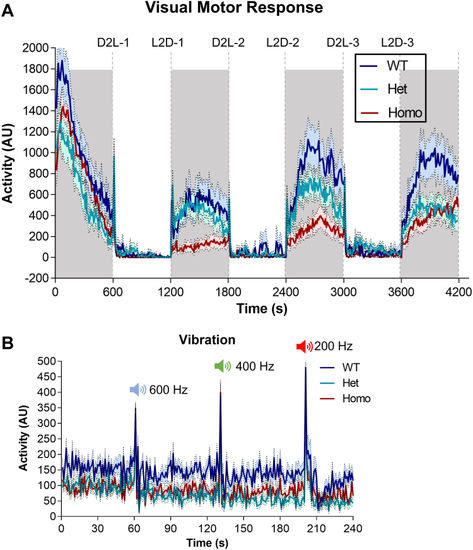
Elovl4b KO larvae show a diminished visual-motor response. A: Activity plot of zebrafish larvae response to light stimulus in alternating light-dark cycles. Homozygous and heterozygous Elovl4b KO fish show reduced activity in response to light-dark cycles compared with WT controls. B: Activity plot of control experiments showing no significant difference in larval response to different sound frequencies. Shaded region = dark. Data plotted as mean ± SEM, N = 32. AU, arbitrary unit; D2L, dark to light transition; Het, heterozygous Elovl4b KO mutant; Homo, homozygous Elovl4b KO mutant zebrafish larvae; L2D, light to dark transition.

PHENOTYPE:
Fish:
Observed In:
Stage: Day 5
Acknowledgments
This image is the copyrighted work of the attributed author or publisher, and ZFIN has permission only to display this image to its users. Additional permissions should be obtained from the applicable author or publisher of the image. Full text @ J. Lipid Res.