
- Title
-
Gene Characterization of Nocturnin Paralogues in Goldfish: Full Coding Sequences, Structure, Phylogeny and Tissue Expression
- Authors
- Madera, D., Alonso-Gómez, A., Delgado, M.J., Valenciano, A.I., Alonso-Gómez, Á.L.
- Source
- Full text @ Int. J. Mol. Sci.

|
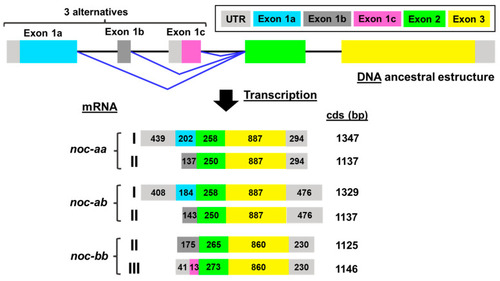
Exon-intron structure and transcription pattern of |
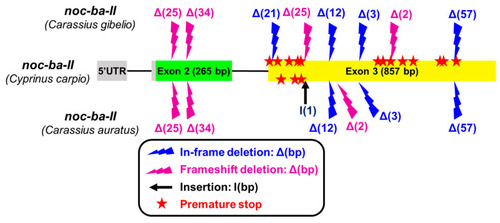
Mutations accumulated in the |
Nucleotide and deduced amino acid sequences of goldfish |
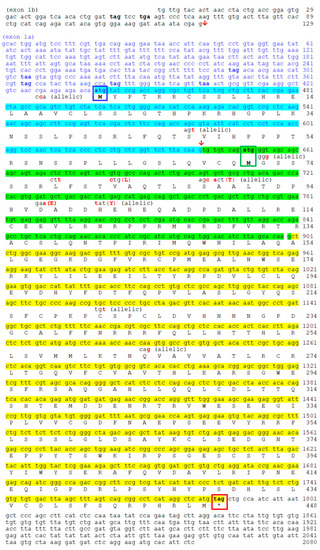
Nucleotide and deduced amino acid sequences of goldfish |
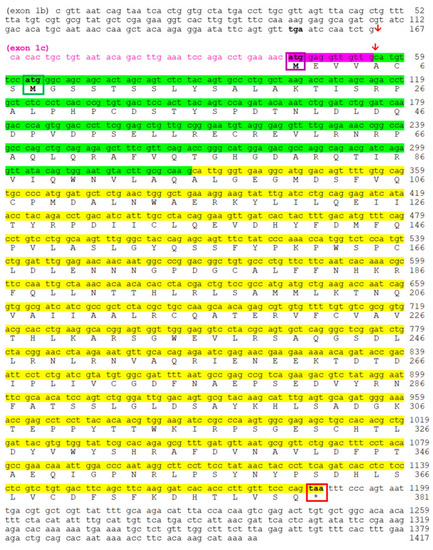
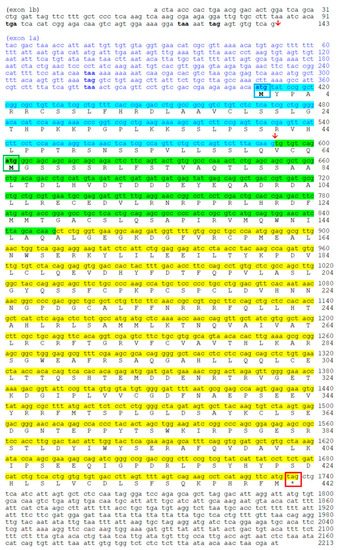
Nucleotide and deduced amino acid sequences of goldfish |
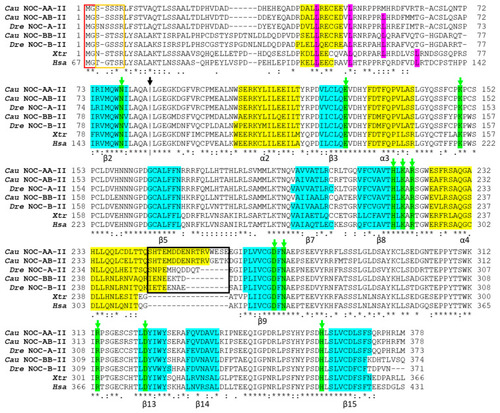
Alignment of the deduced amino acid sequences of splicing variant II of goldfish NOC-AA (Cau NOC-AA-II: WNX29031), NOC-AB (Cau NOC-AB-II: WNX29026), and NOC-BB (Cau NOC-BB-II: WNX29028) with NOC sequences from |
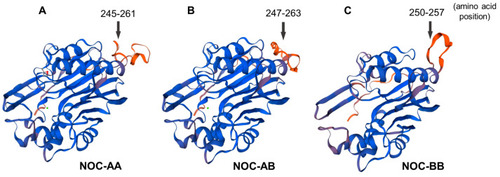
Tertiary predicted 3D structures of splicing variant II of goldfish; nocturnin: NOC-AA ( |
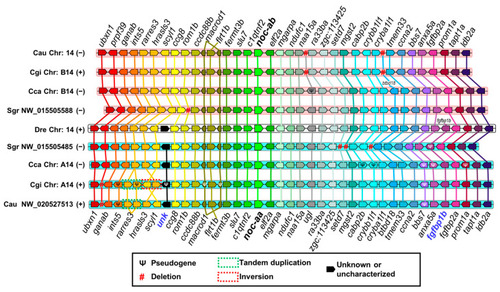
Synteny analysis of |
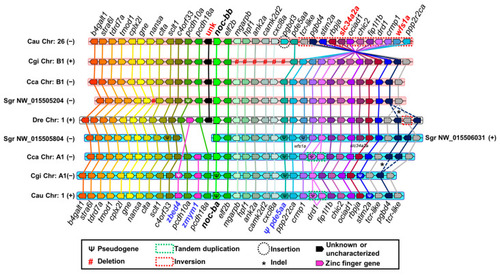
Synteny analysis of |
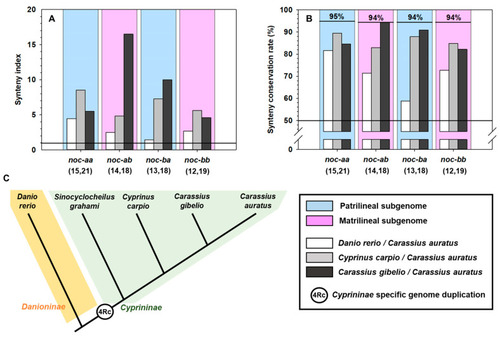
( |
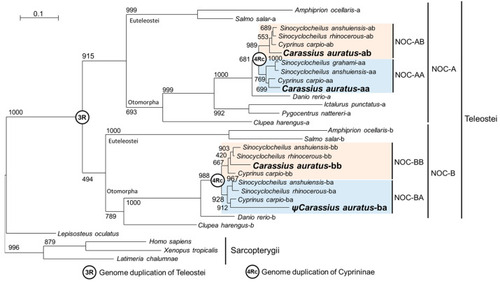
Phylogenetic tree showing the 4Rc relationships among NOC sequences. The evolutionary model used was the Jones–Taylor–Thornton, Gamma-distributed (JTT + G). The tree was inferred by the maximun likelihood method (ML). The numbers in the nodes refer to bootstrap values of a total of 1000 replicates. The scale bar indicates the average number of substitutions per position. The binomial name of the species is given on the right side of the tree. Letters A and B indicate NOC isoforms in teleosts. 3R and 4Rc indicate the proposed whole-genome duplication events in Teleostei and Cyprininae, respectively. Blue and pink boxes indicate the patrilineal of matrilineal clades of Cyprininae species, respectively. Ψ, indicates pseudogene. Species names and GenBank accession numbers of the sequences are indicated in |
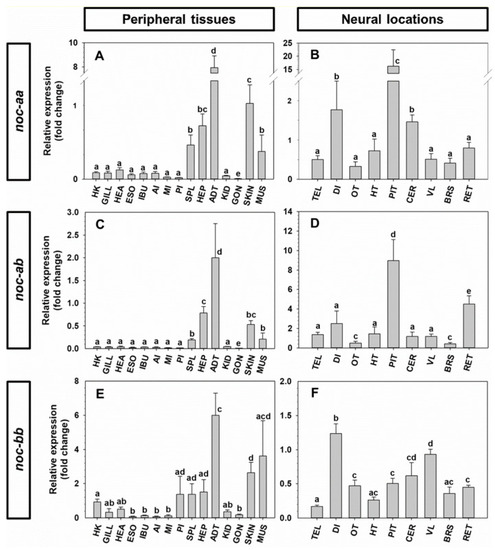
Expression of |

Expression of |