
IMAGE
Figure 14
- ID
- ZDB-IMAGE-240113-23
- Publication
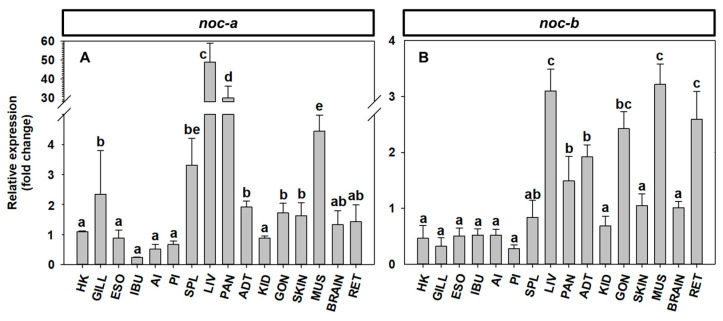
- Madera et al., 2023 - Gene Characterization of Nocturnin Paralogues in Goldfish: Full Coding Sequences, Structure, Phylogeny and Tissue Expression
- All Figures
- Figures for Madera et al., 2023
Image
|
Figure Caption
Figure 14
Expression of
Acknowledgments
This image is the copyrighted work of the attributed author or publisher, and
ZFIN has permission only to display this image to its users.
Additional permissions should be obtained from the applicable author or publisher of the image.
Full text @ Int. J. Mol. Sci.