FIGURE

Figure 11

ID
ZDB-FIG-240113-21
Publication
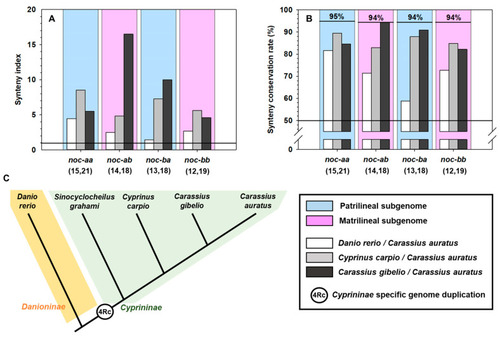
Madera et al., 2023 - Gene Characterization of Nocturnin Paralogues in Goldfish: Full Coding Sequences, Structure, Phylogeny and Tissue Expression
Other Figures
All Figure Page
Back to All Figure Page
Figure 11

(A,B) Synteny index and synteny conservation rate in Carassius auratus compared to Danio rerio (white), Cyprinus carpio (light gray) and Carassius gibelio (dark gray). Numbers in parentheses indicate genes upstream and downstream of the noc paralogue analyzed. Blue and pink backgrounds indicate patrilineal or matrilineal origin of chromosomes, respectively. The lower horizontal line indicates the threshold (1 for synteny index, 50% for synteny conservation rate), where the conserved loci positions are more frequent than the non-conserved. The line above in the graphs in B indicates the maximum synteny conservation rate (%) for each paralogue. (C) Assumed phylogeny of species analyzed in the synteny study.

Expression Data

Expression Detail
Antibody Labeling
Phenotype Data

Phenotype Detail
Acknowledgments
This image is the copyrighted work of the attributed author or publisher, and ZFIN has permission only to display this image to its users. Additional permissions should be obtained from the applicable author or publisher of the image. Full text @ Int. J. Mol. Sci.