FIGURE SUMMARY
Title

The AMPK-Sirtuin 1-YAP axis is regulated by fluid flow intensity and controls autophagy flux in kidney epithelial cells

Authors
Claude-Taupin, A., Isnard, P., Bagattin, A., Kuperwasser, N., Roccio, F., Ruscica, B., Goudin, N., Garfa-Traoré, M., Regnier, A., Turinsky, L., Burtin, M., Foretz, M., Pontoglio, M., Morel, E., Viollet, B., Terzi, F., Codogno, P., Dupont, N.
Source
Full text @ Nat. Commun.

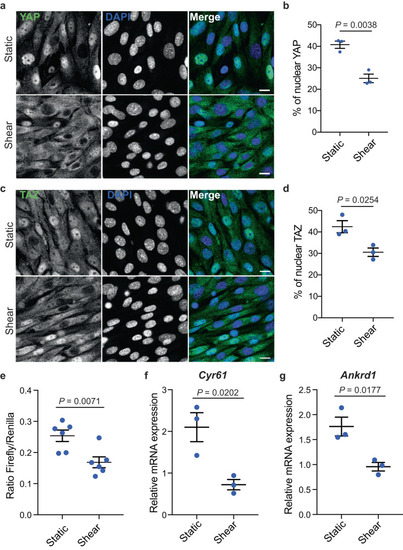
Physiological shear stress inhibits YAP/TAZ.

a, b Representative images (a) and quantification (b) of YAP localization in the nucleus, labeled with DAPI, in KECs subjected to flow (shear) or not (static) during 24 h. Data show the mean ± s.e.m.; n = 3 independent experiments, two-sided t-test. Scale bars, 10 µm. c, d Representative images (c) and quantification (d) of TAZ nuclear localization in KECs subjected to flow (shear) or not (static) during 24 h. Data show the mean ± s.e.m.; n = 3 independent experiments, two-sided t-test. Scale bars, 10 µm. e Luciferase assay for YAP/TAZ activity in KECs subjected to shear stress or not (static) during 24 h. Data show the mean ± s.e.m.; n = 6 from 3 independent experiments, two-sided t-test. f, g Expression of Cyr61 (f) and Ankrd1 (g) in KECs subjected to flow (shear) or not (static) during 24 h. mRNA levels were quantified by real-time RT-qPCR, normalized to β-actin and are presented as fold increases. Data show the mean ± s.e.m.; n = 3 independent experiments, two-sided t-test. Source data are provided as a Source Data file.

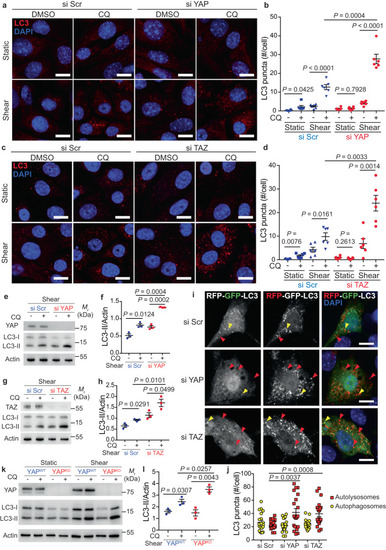
The loss of YAP or TAZ stimulates the autophagy flux during shear stress.

a, b Representative images (a) and quantification (b) of LC3 puncta in KECs after transfection with a control siRNA (si Scr) or siRNA against YAP, then subjected to flow (shear) or not (static) during 24 h in the presence or absence of chloroquine (CQ). #: number. c, d Representative images (c) and quantification (d) of LC3 puncta in KECs after transfection with a control siRNA (si Scr) or siRNA against TAZ, then subjected to flow (shear) or not (static) during 24 h in the presence or absence of chloroquine (CQ). e Representative images of YAP, LC3-I, LC3-II and Actin proteins levels in KECs after transfection with a control siRNA (si Scr) or siRNA against YAP, subjected to flow (shear, 24 h) or not (static), in the presence or absence of chloroquine (CQ), by western blot analysis. f The ratio of LC3-II to Actin was determined by densitometry, relative to panel e. g Representative images of TAZ, LC3-I, LC3-II and Actin proteins levels in KECs after transfection with a control siRNA (si Scr) or siRNA against TAZ, subjected to flow (shear, 24 h) or not (static), in the presence or absence of chloroquine (CQ), by western blot analysis. h The ratio of LC3-II to Actin was determined by densitometry, relative to panel g. i, j Representative images (i) and quantification (j) of mRFP-GFP-LC3 puncta in KECs transfected with the mRFP–GFP–LC3 tandem probe, subjected to shear stress during 24 h. k Representative images of YAP, LC3-I, LC3-II and Actin proteins levels in WT (YAPWT) and (YAPKO) KECs (CRISPR Cas9) subjected to flow (shear, 24 h) or not (static), in the presence or absence of chloroquine (CQ), by western blot analysis. l The ratio of LC3-II to Actin was determined by densitometry, relative to panel k. b, d, j Data show the mean ± s.e.m.; n = 6 (b, d) or n = 20 (j) from 3 independent experiments, two-sided t-test. Scale bars, 10 µm. f, h, l Data show the mean ± s.e.m.; n = 3 independent experiments, two-sided t-test. Source data are provided as a Source Data file.

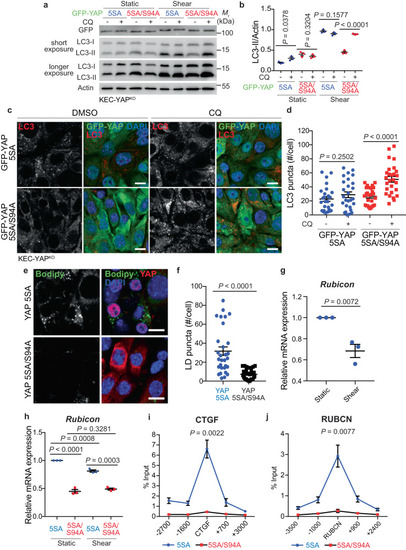
The expression of a constitutively active form of YAP inhibits autophagy flux during shear stress.

a Representative images of GFP, LC3-I, LC3-II and Actin proteins levels in KECs expressing a constitutively active (5SA) or inactive (5SA/S94A) form of GFP-YAP, then subjected to flow (shear, 24 h) or not (static), in the presence or absence of chloroquine (CQ), by western blot analysis. b The ratio of LC3-II to Actin was determined by densitometry, relative to panel a. Data show the mean ± s.e.m.; n = 3 independent experiments, two-sided t-test. c, d Representative images (c) and quantification (d) of LC3 puncta in KECs expressing a constitutively active (5SA) or inactive (5SA/S94A) form of GFP-YAP, then subjected to shear stress during 24 h in the presence or absence of chloroquine (CQ). Data show the mean ± s.e.m.; n = 27 individual data points from 3 independent experiments, two-sided t-test. Scale bars, 10 µm. e, f Representative images (e) and quantification (f) of LDs (Bodipy) in KECs expressing a constitutively active (5SA) or inactive (5SA/S94A) form of YAP, then subjected to shear stress during 24 h. Data show the mean ± s.e.m.; n = 30 individual data points from 3 independent experiments, two-sided t-test. Scale bars, 10 µm. g Expression of Rubicon in KECs subjected to flow (shear) or not (static) during 24 h. mRNA levels were quantified by real-time RT-qPCR, normalized to β-actin and are presented as fold increases. h Expression of Rubicon in KECs expressing a constitutively active (5SA) or inactive (5SA/S94A) form of YAP, then subjected to flow (shear) or not (static) during 24 h. mRNA levels were quantified by real-time RT-qPCR, normalized to β-actin and are presented as fold increases. i, j Relative enrichment of YAP (ChIP GFP-YAP, % input) on the CTGF (i) and RUBICON (j) genes in KECs expressing a constitutively active (5SA) or inactive (5SA/S94A) form of GFP-YAP. The P-value represent the statistical difference between the 5SA and 5SA/S94A condition at the binding sequence. gj Data show the mean ± s.e.m.; n = 3 independent experiments, two-sided t-test. Source data are provided as a Source Data file.

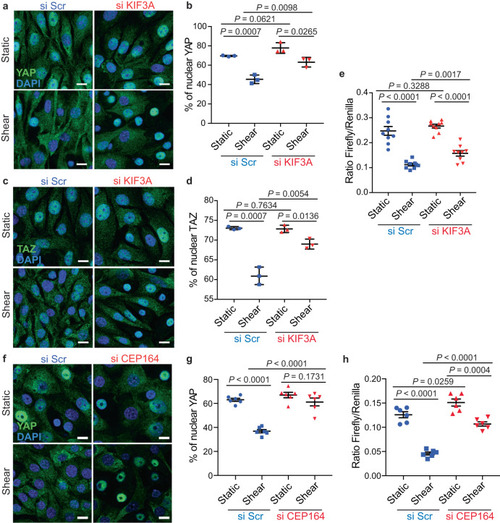
YAP/TAZ inactivation by shear stress requires a functional primary cilium.

a, b Representative images (a) and quantification (b) of YAP nuclear localization in KECs after transfection with a control siRNA (si Scr) or siRNA against KIF3A, subjected to flow (shear) or not (static) during 24 h. Data show the mean ± s.e.m.; n = 3 independent experiments, two-sided t-test. Scale bars, 10 µm. c, d Representative images (c) and quantification (d) of TAZ nuclear localization in KECs after transfection with a control siRNA (si Scr) or siRNA against KIF3A, subjected to flow (shear) or not (static) during 24 h. Data show the mean ± s.e.m.; n = 3 independent experiments, two-sided t-test. Scale bars, 10 µm. e Luciferase assay for YAP/TAZ activity in KECs subjected to shear stress or not (static) during 24 h, after a knockdown of KIF3A. Data show the mean ± s.e.m.; n = 9 from 3 independent experiments, two-sided t-test. f, g Representative images (f) and quantification (g) of YAP nuclear localization in KECs after transfection with a control siRNA (si Scr) or siRNA against CEP164, subjected to flow (shear) or not (static) during 24 h. Data show the mean ± s.e.m.; n = 6 from 3 independent experiments, two-sided t-test. Scale bars, 10 µm. h Luciferase assay for YAP/TAZ activity in KECs subjected to shear stress or not (static) during 24 h, after a knockdown of CEP164. Data show the mean ± s.e.m.; n = 6 from 3 independent experiments, two-sided t-test. Source data are provided as a Source Data file.

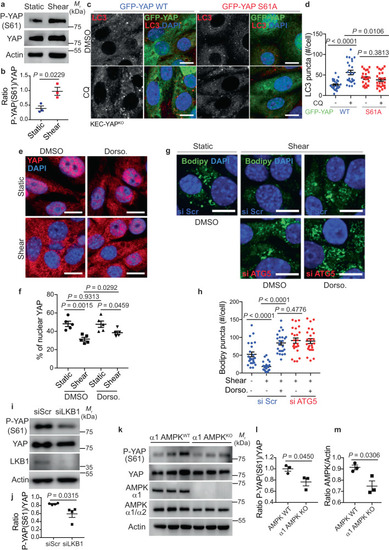
AMPK-dependent phosphorylation of YAP at S61 regulates autophagy upon fluid flow.

a Representative images of P-YAP (S61), YAP and Actin proteins levels in KECs subjected to flow (shear) or not (static) during 24 h, by western blot analysis. b The ratio of P-YAP (S61) to YAP was determined by densitometry, relative to panel a. Data show the mean ± s.e.m.; n = 3 independent experiments, two-sided t-test. c, d Representative images (c) and quantification (d) of LC3 puncta in KECs expressing a wild-type (WT) or a mutant (S61A) form of GFP-YAP, subjected to shear stress during 24 h in the presence or absence of chloroquine (CQ). e, f Representative images (e) and quantification (f) of YAP nuclear localization in KECs treated or not with dorsomorphin (Dorso.), subjected to flow (shear) or not (static) during 24 h. Scale bars, 10 µm. g, h Representative images (g) and quantification (h) of lipid droplets (Bodipy) in KECs, after transfection with a control siRNA (si Scr) or siRNA against ATG5, treated or not with dorsomorphin (Dorso.) and subjected to flow (shear) or not (static) during 24 h. i Representative images of P-YAP (S61), YAP, LKB1 and Actin proteins levels in KECs after transfection with a control siRNA (si Scr) or siRNA against LKB1 subjected to flow (shear) during 24 h, by western blot analysis. j The ratio of P-YAP (S61) to YAP was determined by densitometry, relative to panel i. k Representative images of P-YAP (S61), YAP, α1 AMPK, total AMPK (α1/α2) and Actin proteins levels in kidney samples from wild-type (WT) or AMPK α1 KO mice, by western blot analysis. l The ratio of P-YAP (S61) to YAP was determined by densitometry, relative to panel k. m The ratio of AMPK to Actin was determined by densitometry, relative to panel k. d, h Data show the mean ± s.e.m.; n = 24 individual data points from 3 independent experiments, two-sided t-test. Scale bars, 10 µm. f, j Data show the mean ± s.e.m.; n = 5 (f) or n = 4 (j) independent experiments, two-sided t-test. l, m Data show the mean ± s.e.m.; n = 3 kidney samples from WT or AMPK α1 KO mice, two-sided t-test. Source data are provided as a Source Data file.

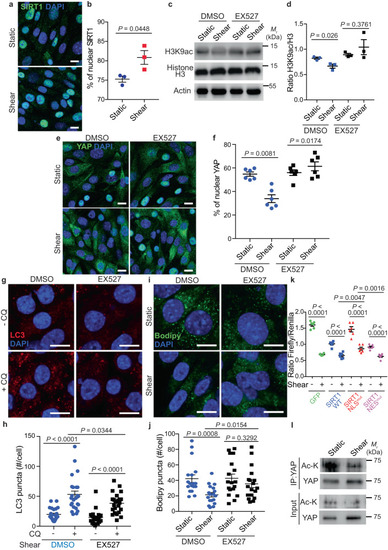
SIRT1 induces YAP nuclear exclusion upon fluid flow.

a, b Representative images (a) and quantification (b) of SIRT1 nuclear localization in KECs subjected to shear stress during 24 h. Data show the mean ± s.e.m.; n = 3 independent experiments, two-sided t-test. Scale bars, 10 µm. c Representative images of H3K9ac, Histone H3 and Actin proteins levels in KECs subjected to flow (shear) or not (static) during 24 h, treated or not with EX527, by western blot analysis. d The ratio of H3K9ac to Histone H3 was determined by densitometry. Data show the mean ± s.e.m.; n = 3 independent experiments, two-sided t-test. e, f Representative images (e) and quantification (f) of YAP nuclear localization in KECs treated or not with EX527, subjected to flow (shear) or not (static) during 24 h. Data show the mean ± s.e.m.; n = 6 individual data points from 3 independent experiments, two-sided t-test. Scale bars, 10 µm. g, h Representative images (g) and quantification (h) of LC3 puncta in KECs subjected to flow (shear) or not (static) during 24 h, in the presence or absence of EX527 and chloroquine (CQ). Data show the mean ± s.e.m.; n = 24 individual data points from 3 independent experiments, two-sided t-test. Scale bars, 10 µm. i, j Representative images (i) and quantification (j) of lipid droplets (Bodipy) in KECs treated or not with EX527, subjected to flow (shear) or not (static) during 24 h. Data show the mean ± s.e.m.; n = 18 individual data points from 3 independent experiments, two-sided t-test. Scale bars, 10 µm. k Luciferase assay for YAP/TAZ activity in KECs transfected with GFP or GFP-SIRT1 WT or its mutated forms (SIRT1 NLSmut or SIRT1 NESmut), subjected to shear stress or not (static) during 24 h. Data show the mean ± s.e.m.; n = 6 from 3 independent experiments, two-sided t-test. l Immunoprecipitation analysis of YAP in KECs subjected to flow (shear) or not (static) during 24 h. Representative images of YAP and acetylated proteins are shown from n = 3 independent experiments. Source data are provided as a Source Data file.

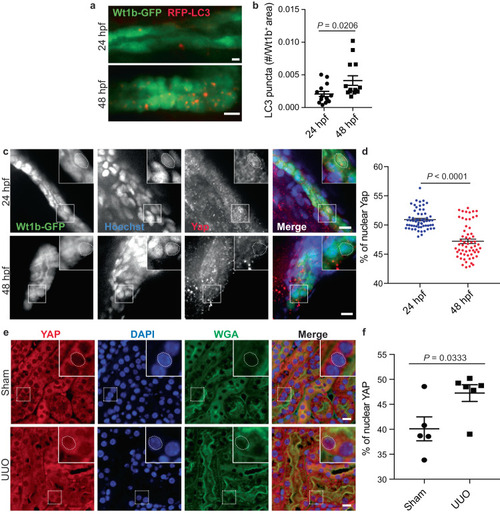
YAP subcellular localization is associated to autophagy activity in vivo.

a, b Representative images (a) and quantification (b) of RFP-LC3 puncta in Wt1b-GFP+ pronephros, at 24 h post fertilization (hpf) and 48 hpf. Data show the mean ± s.e.m.; n = 18 individual data points from 3 independent experiments, two-sided t-test. Scale bars, 10 µm. c, d Representative images (c) and quantification (d) of YAP nuclear localization in Wt1b-GFP+ pronephros at 24 and 48 hpf. Nucleus were labeled with Hoechst. Data show the mean ± s.e.m.; n = 60 individual data points from 3 independent experiments, two-sided t-test. Scale bars, 10 µm. e, f Mice subjected to unilateral ureteral obstruction (UUO) or sham operation were euthanized 24 h after surgery and kidney sections subjected to immunohistochemistry for YAP and renal tubule marker Wheat Germ Agglutinin (WGA). e Representative images. Scale bars, 10 µm. f Quantification of YAP nuclear levels in the renal tubules (WGA+). Data show the mean ± s.e.m.; n = 5 (sham) and n = 6 (UUO) different mice. two-sided t-test. Source data are provided as a Source Data file.

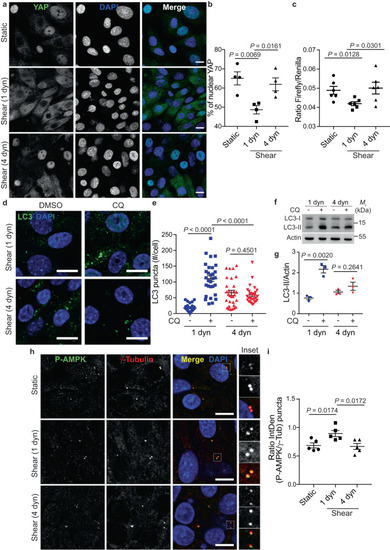
Pathological flow induces YAP nuclear translocation and inhibits autophagy.

a, b Representative images (a) and quantification (b) of YAP nuclear localization in KECs subjected to physiological flow (shear 1 dyn) or not (static) during 48 h. For pathological flow (4 dyn), KECs were subjected to physiological shear stress (1 dyn) during 24 h before increasing the flow rate to 4 dyn.cm−2 during one more day. Data show the mean ± s.e.m.; n = 4 independent experiments, two-sided t-test. Scale bars, 10 µm. c Luciferase assay for YAP/TAZ activity in KECs subjected to shear stress or not (static) during 48 h, as described for a. 1 dyn = Physiological flow. 4 dyn = pathological flow. Data show the mean ± s.e.m.; n = 6 from 3 independent experiments, two-sided t-test. d, e Representative images (d) and quantification (e) of LC3 puncta in KECs subjected to physiological flow (shear 1 dyn) or pathological flow (shear 4 dyn, as described in panel a), in the presence or absence chloroquine (CQ). Data show the mean ± s.e.m.; n = 30 individual data points from 3 independent experiments, two-sided t-test. Scale bars, 10 µm. f, g Representative images of LC3-I, LC3-II and Actin proteins levels in KECs subjected physiological flow (shear 1 dyn) or pathological flow (shear 4 dyn, as described in panel a), in the presence or absence chloroquine (CQ), by western blot analysis. g The ratio of LC3-II to Actin was determined by densitometry, relative to panel f. Data show the mean ± s.e.m.; n = 3 independent experiments, two-sided t-test. h, i Representative images (h) and quantification (i) of colocalization between phosphorylated AMPK (P-AMPK) and centrioles (γ-Tubulin) in KECs subjected to physiological flow (shear 1 dyn), pathological flow (shear 4 dyn, as described in panel a), or not (Static). Data show the mean ± s.e.m. of P-AMPK intensity, compared with γ-tubulin intensity; n = 5 independent experiments, two-sided t-test. Scale bars, 10 µm. Source data are provided as a Source Data file.

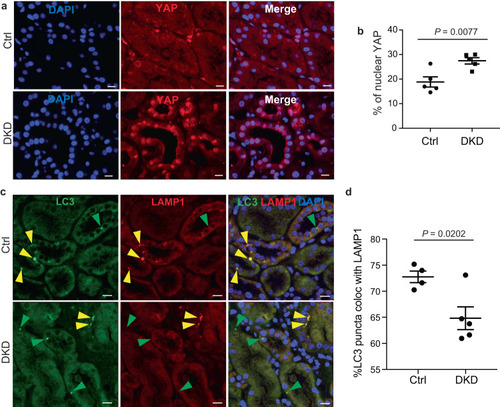
YAP reactivation upon chronic kidney disease is correlated with autophagy inhibition.

a Representative images of kidney sections subjected to immunohistochemistry for YAP from controls (n = 5) and patients with diabetic nephropathy (DKD, n = 5) Scale bars, 30 µm. b Quantification of YAP nuclear levels in the renal tubules. Data show the mean ± s.e.m.; n = 5. two-sided t-test. c Representative images of kidney sections subjected to immunohistochemistry for LC3 and LAMP1 from controls and patients with diabetic nephropathy (n = 5) Scale bars, 30 µm. d Quantification of colocalization between LC3 and LAMP1 in the renal tubules. Data show the mean ± s.e.m.; n = 4 (controls) and n = 5 (diabetic nephropathy). two-sided t-test. Source data are provided as a Source Data file.

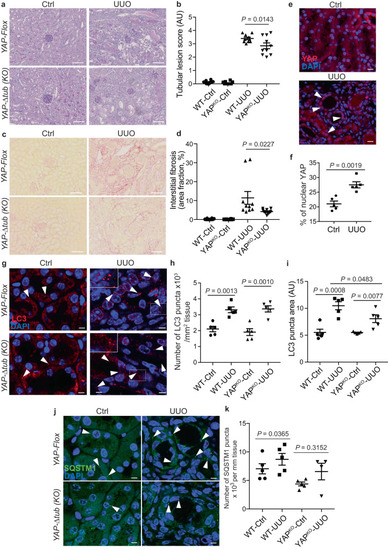
The YAP/autophagy crosstalk promotes renal interstitial fibrosis during unilateral ureteral obstruction.

a, b Representative images (a) of the kidney cortex of control contralateral kidneys and obstructed kidneys (UUO kidney) 14 days after surgery in YapΔtub mice and Yapflox littermates (PAS staining, original magnification X200) and quantification (b) of the tubular injury score. Data show the mean ± s.e.m.; n = 10 for each experimental group. ANOVA, followed by the two-sided Tukey-Kramer test. c, d Representative images (c) of the kidney cortex of control contralateral kidneys and obstructed kidneys (UUO kidney) 14 days after surgery in YapΔtub mice and Yapflox littermates (picrosirius staining, original magnification X200) and quantification (d) of the interstitial fibrosis area. Data show the mean ± s.e.m.; n = 10 for each experimental group. ANOVA, followed by the two-sided Tukey-Kramer test. e, f Representative images (e) of kidney sections subjected to immunohistochemistry for YAP. Scale bars, 30 µm (f) Quantification of YAP nuclear levels in the renal tubules. Data show the mean ± s.e.m.; n = 5 mice. two-sided t-test. g–i Representative images of control contralateral kidneys and obstructed kidneys (UUO kidney) in YapΔtub mice and Yapflox littermates subjected to immunohistochemistry for LC3. Scale bars, 10 µm. h, i Quantification of LC3 puncta number (h) and size (i) in the renal tubules. Data show the mean ± s.e.m.; n = 5 for each experimental group. two-sided t-test. j, k Representative images (j) of kidney sections subjected to immunohistochemistry for SQSTM1. Scale bars, 10 µm. k Quantification of SQSTM1 puncta in the renal tubules. Data show the mean ± s.e.m.; n = 5 for each experimental group. two-sided t-test. Source data are provided as a Source Data file.

Acknowledgments
This image is the copyrighted work of the attributed author or publisher, and ZFIN has permission only to display this image to its users. Additional permissions should be obtained from the applicable author or publisher of the image. Full text @ Nat. Commun.