|
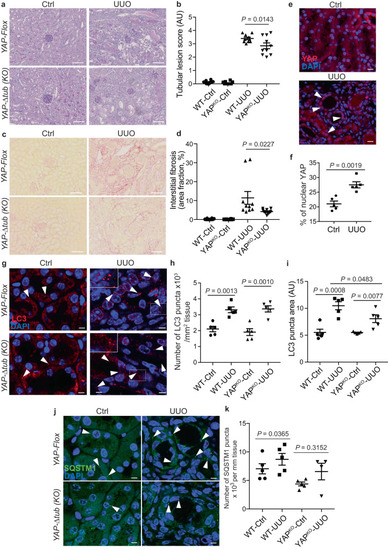
The YAP/autophagy crosstalk promotes renal interstitial fibrosis during unilateral ureteral obstruction. a, b Representative images (a) of the kidney cortex of control contralateral kidneys and obstructed kidneys (UUO kidney) 14 days after surgery in YapΔtub mice and Yapflox littermates (PAS staining, original magnification X200) and quantification (b) of the tubular injury score. Data show the mean ± s.e.m.; n = 10 for each experimental group. ANOVA, followed by the two-sided Tukey-Kramer test. c, d Representative images (c) of the kidney cortex of control contralateral kidneys and obstructed kidneys (UUO kidney) 14 days after surgery in YapΔtub mice and Yapflox littermates (picrosirius staining, original magnification X200) and quantification (d) of the interstitial fibrosis area. Data show the mean ± s.e.m.; n = 10 for each experimental group. ANOVA, followed by the two-sided Tukey-Kramer test. e, f Representative images (e) of kidney sections subjected to immunohistochemistry for YAP. Scale bars, 30 µm (f) Quantification of YAP nuclear levels in the renal tubules. Data show the mean ± s.e.m.; n = 5 mice. two-sided t-test. g–i Representative images of control contralateral kidneys and obstructed kidneys (UUO kidney) in YapΔtub mice and Yapflox littermates subjected to immunohistochemistry for LC3. Scale bars, 10 µm. h, i Quantification of LC3 puncta number (h) and size (i) in the renal tubules. Data show the mean ± s.e.m.; n = 5 for each experimental group. two-sided t-test. j, k Representative images (j) of kidney sections subjected to immunohistochemistry for SQSTM1. Scale bars, 10 µm. k Quantification of SQSTM1 puncta in the renal tubules. Data show the mean ± s.e.m.; n = 5 for each experimental group. two-sided t-test. Source data are provided as a Source Data file.
|