|
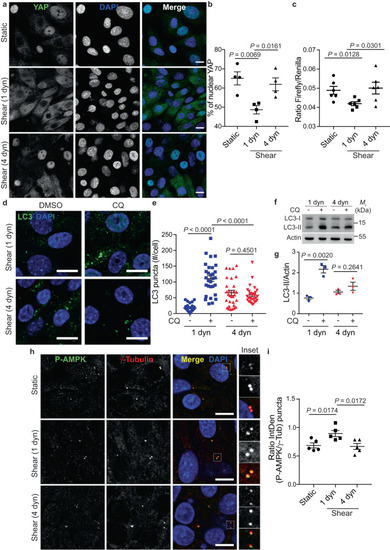
Pathological flow induces YAP nuclear translocation and inhibits autophagy. a, b Representative images (a) and quantification (b) of YAP nuclear localization in KECs subjected to physiological flow (shear 1 dyn) or not (static) during 48 h. For pathological flow (4 dyn), KECs were subjected to physiological shear stress (1 dyn) during 24 h before increasing the flow rate to 4 dyn.cm−2 during one more day. Data show the mean ± s.e.m.; n = 4 independent experiments, two-sided t-test. Scale bars, 10 µm. c Luciferase assay for YAP/TAZ activity in KECs subjected to shear stress or not (static) during 48 h, as described for a. 1 dyn = Physiological flow. 4 dyn = pathological flow. Data show the mean ± s.e.m.; n = 6 from 3 independent experiments, two-sided t-test. d, e Representative images (d) and quantification (e) of LC3 puncta in KECs subjected to physiological flow (shear 1 dyn) or pathological flow (shear 4 dyn, as described in panel a), in the presence or absence chloroquine (CQ). Data show the mean ± s.e.m.; n = 30 individual data points from 3 independent experiments, two-sided t-test. Scale bars, 10 µm. f, g Representative images of LC3-I, LC3-II and Actin proteins levels in KECs subjected physiological flow (shear 1 dyn) or pathological flow (shear 4 dyn, as described in panel a), in the presence or absence chloroquine (CQ), by western blot analysis. g The ratio of LC3-II to Actin was determined by densitometry, relative to panel f. Data show the mean ± s.e.m.; n = 3 independent experiments, two-sided t-test. h, i Representative images (h) and quantification (i) of colocalization between phosphorylated AMPK (P-AMPK) and centrioles (γ-Tubulin) in KECs subjected to physiological flow (shear 1 dyn), pathological flow (shear 4 dyn, as described in panel a), or not (Static). Data show the mean ± s.e.m. of P-AMPK intensity, compared with γ-tubulin intensity; n = 5 independent experiments, two-sided t-test. Scale bars, 10 µm. Source data are provided as a Source Data file.
|