
- Title
-
Transcriptomic profiling of TLR-7-mediated immune-challenge in zebrafish embryos in the presence and absence of glucocorticoid-induced immunosuppression
- Authors
- Luckner, B., Essfeld, F., Ayobahan, S.U., Richling, E., Eilebrecht, E., Eilebrecht, S.
- Source
- Full text @ Ecotoxicol. Environ. Saf.
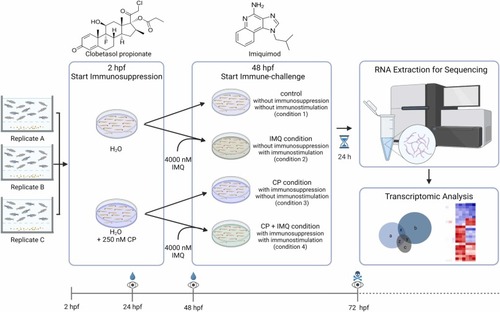
Experimental workflow. Embryos originating from three different spawning groups were used for experiments from approx. 2 hpf onwards with 15 embryos per condition and replicate. For immunosuppression, embryos were exposed to CP dissolved in the medium from 2 hpf until the end of the experiment. At 48 hpf, embryos were transferred to new media (with CP if needed). For all conditions comprising an immunostimulation, this medium additionally contained 4000 nM IMQ. For the bioinformatical analysis of transcriptomic profiles of treated embryos, total RNA was extracted at 72 hpf and sequenced. The icons on the lower timescales indicate performed medium exchanges (droplet), microscopical inspections of apical observations (eye) and the euthanasia of embryos (skull). All conditions mentioned in the text are indicated with numbers or the respective compound. (2-column-fitting image, colour print). |
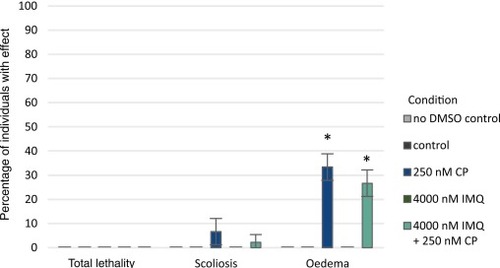
Recorded incidences of lethal events and observed morphological abnormalities at 72 hpf. n = 3 with each 15 embryos. Error bars show SEM. Level of significance was calculated compared to the control with * = p < 0.05. PHENOTYPE:
|
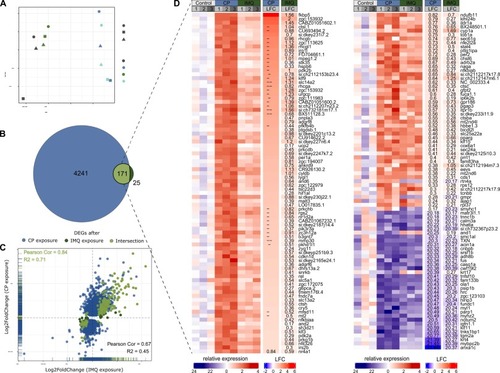
Transcriptomic profiling of immunosuppressed and/or immune-challenged zebrafish embryos at 72 hpf. Immunosuppression was triggered by an exposure to CP from 2 hpf – 72 hpf. Immunostimulation was triggered by an exposure to IMQ from 48 hpf – 72 hpf. n = 3 with 15 embryos each. A: PCA plot visualising the variance between the biological replicates (shapes) and conditions (colours) based on the rlog normalised gene counts of a total of 18994 detected and annotated genes. Total contribution of each principal component (PC) is displayed in percent. B: Venn diagram comparing the total number of detected DEGs in CP-exposed and IMQ-exposed embryos compared to the untreated control and the set of commonly detected DEGs (intersection). Differences in gene expressions were considered significant with a padj. < 0.05 with an applied LFC cut-off at the 50th quantile on LFC-shrunk values. C: Scatter plot comparing the LFC values of all mentioned genes of B in both conditions. Correlation measures in black font refer to all detected DEGs, those in green font only refer to the common set of shared DEGs. D: Heatmap of the 171 commonly detected genes between both conditions showing the relative expression of each gene for each biological replicate compared to the average expression in the control. The righthanded heatmap is a continuation of the left one. Red labels indicate an upregulation, blue labels a downregulation of gene expression. Boxes on top show the conditions (colours) and the replicate (grey). Additionally, the mean LFC values between all biological replicates are depicted on the righthand side for both conditions. Asterixis indicate genes regulated in opposite directions in response to both compounds. EXPRESSION / LABELING:
PHENOTYPE:
|
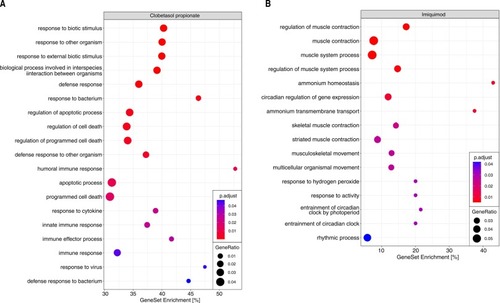
Results of the ORA on CP-responsive and IMQ-responsive DEGs on GO terms for biological processes. Gene ratio is defined as the ratio between the number of genes assigned to a specific term and the total number of genes assigned to at least one term during the analysis. Gene set enrichment is defined as the ratio between the number of genes assigned to a specific term and the size of the gene set defining this term. DEGs from the respective DGEAs were used as an input for each ORA. A: Selection of terms related to the immune-response or inflammation out of the 189 significantly overrepresented (padj. < 0.05, minimum 2 genes per terms) terms in response to CP. 3442 genes were assignable to at least one term. A list of all overrepresented GO terms on biological processes is provided in the supplementary information. B: All overrepresented terms on biological processes in response to IMQ. 141 genes were assignable to at least one term. PHENOTYPE:
|
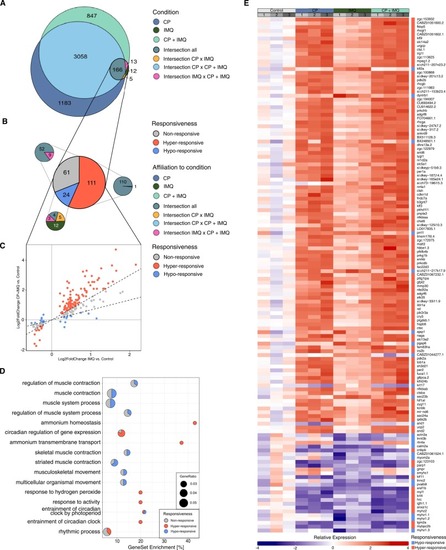
CP-dependent alterations of IMQ-responsive DEGs in their responsiveness to IMQ. A: Venn diagram showing the number of DEGs solely detected in each condition (turquoise, dark blue, dark green) and the sets of commonly detected DEGs between conditions (intersections). Differences in gene expression compared to the untreated control were considered significant with a padj. < 0.05 with an applied LFC cut-off at the 50th quantile on LFC-shrunk values. B: Pie chart showing the partitions of IMQ-responsive DEGs characterised as non- (grey), hypo- (blue) or hyper-responsive (red). Smaller pie charts display the subdivisions of each characterisation with the respective affiliation to the areas in A by matching colours. C: Scatter plot comparing the LFC values in the IMQ and the CP+IMQ condition. Colours correspond to their classification as non-, hypo- or hyper-responsive genes. Dotted lines illustrate the threshold of classification. D: Proportion of non- (grey), hypo- (blue) and hyper-responsive (red) genes in the gene sets defining the GO terms found to be overrepresented in response to IMQ (ORA). E: Heatmap showing the relative expression rates of all 134 genes identified as either hypo- or hyper-responsive normalised by the average expression in the control condition. A downregulation of the expression is indicated by blue, an upregulation by red, the stronger the darker. Grey boxes on top reflect the biological replicates, coloured boxes reflect the respective condition. The rightmost column of each heatmap displays the classification of the gene to be either hypo- (blue) or hyper-responsive (red). EXPRESSION / LABELING:
PHENOTYPE:
|
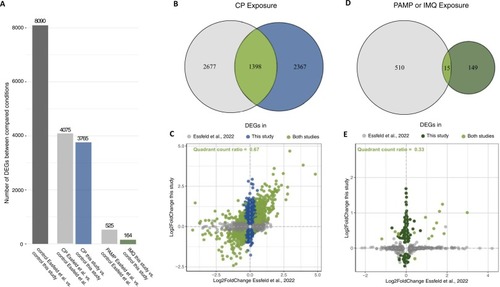
Interstudy comparison of transcriptomic profiles analysed in Essfeld et al. (2022) and this study. Data of Essfeld et al. (2022) was bioinformatically reanalysed applying similar parameters and thresholds used in the current study and with equalised universes of detected DEGs. A common set of 15723 genes was compared. A: Number of DEGs between the respective control conditions of both studies representing the impact of the methodological differences (dark grey), and the number of DEGs detected in response to the immunosuppression (grey and blue) or the immunostimulation (grey and dark green) compared to the respective control conditions. B+D: Venn diagrams showing the number of CP-responsive (B) and PAM- or IMQ-responsive (D) DEGs detected in each study as well as the number of commonly detected DEGs (intersections). C+E: Scatter plot visualising the LFC values of all detected DEGs mentioned in B (C) or D (E). Quadrant count ratios were calculated based on the set of commonly detected DEGs (intersections, bright green). |