
|
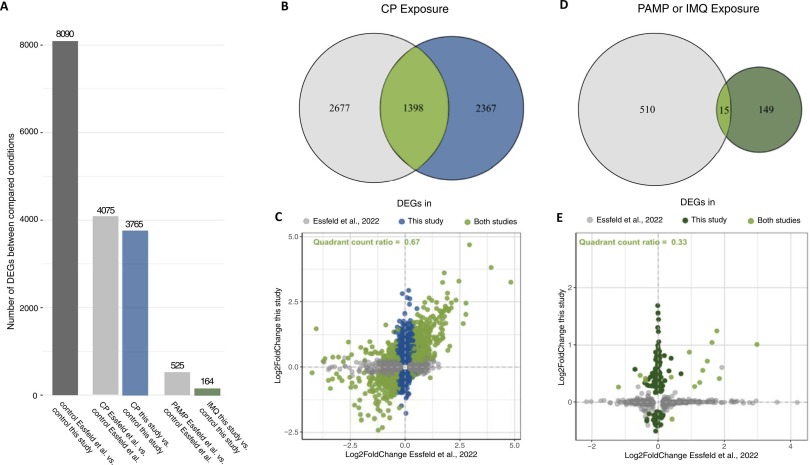
Fig. 6 Interstudy comparison of transcriptomic profiles analysed in Essfeld et al. (2022) and this study. Data of Essfeld et al. (2022) was bioinformatically reanalysed applying similar parameters and thresholds used in the current study and with equalised universes of detected DEGs. A common set of 15723 genes was compared. A: Number of DEGs between the respective control conditions of both studies representing the impact of the methodological differences (dark grey), and the number of DEGs detected in response to the immunosuppression (grey and blue) or the immunostimulation (grey and dark green) compared to the respective control conditions. B+D: Venn diagrams showing the number of CP-responsive (B) and PAM- or IMQ-responsive (D) DEGs detected in each study as well as the number of commonly detected DEGs (intersections). C+E: Scatter plot visualising the LFC values of all detected DEGs mentioned in B (C) or D (E). Quadrant count ratios were calculated based on the set of commonly detected DEGs (intersections, bright green).