
Fig. 5
|
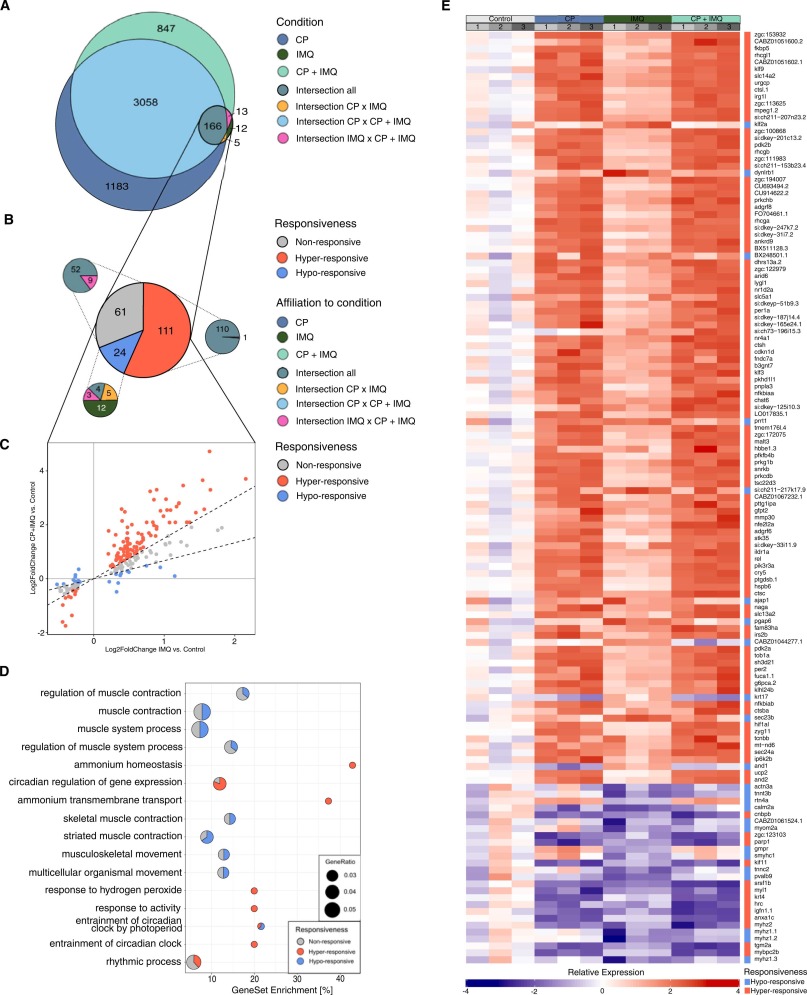
Fig. 5 CP-dependent alterations of IMQ-responsive DEGs in their responsiveness to IMQ. A: Venn diagram showing the number of DEGs solely detected in each condition (turquoise, dark blue, dark green) and the sets of commonly detected DEGs between conditions (intersections). Differences in gene expression compared to the untreated control were considered significant with a padj. < 0.05 with an applied LFC cut-off at the 50th quantile on LFC-shrunk values. B: Pie chart showing the partitions of IMQ-responsive DEGs characterised as non- (grey), hypo- (blue) or hyper-responsive (red). Smaller pie charts display the subdivisions of each characterisation with the respective affiliation to the areas in A by matching colours. C: Scatter plot comparing the LFC values in the IMQ and the CP+IMQ condition. Colours correspond to their classification as non-, hypo- or hyper-responsive genes. Dotted lines illustrate the threshold of classification. D: Proportion of non- (grey), hypo- (blue) and hyper-responsive (red) genes in the gene sets defining the GO terms found to be overrepresented in response to IMQ (ORA). E: Heatmap showing the relative expression rates of all 134 genes identified as either hypo- or hyper-responsive normalised by the average expression in the control condition. A downregulation of the expression is indicated by blue, an upregulation by red, the stronger the darker. Grey boxes on top reflect the biological replicates, coloured boxes reflect the respective condition. The rightmost column of each heatmap displays the classification of the gene to be either hypo- (blue) or hyper-responsive (red).