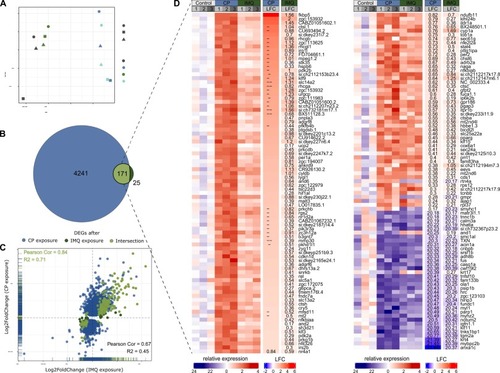
Transcriptomic profiling of immunosuppressed and/or immune-challenged zebrafish embryos at 72 hpf. Immunosuppression was triggered by an exposure to CP from 2 hpf – 72 hpf. Immunostimulation was triggered by an exposure to IMQ from 48 hpf – 72 hpf. n = 3 with 15 embryos each. A: PCA plot visualising the variance between the biological replicates (shapes) and conditions (colours) based on the rlog normalised gene counts of a total of 18994 detected and annotated genes. Total contribution of each principal component (PC) is displayed in percent. B: Venn diagram comparing the total number of detected DEGs in CP-exposed and IMQ-exposed embryos compared to the untreated control and the set of commonly detected DEGs (intersection). Differences in gene expressions were considered significant with a padj. < 0.05 with an applied LFC cut-off at the 50th quantile on LFC-shrunk values. C: Scatter plot comparing the LFC values of all mentioned genes of B in both conditions. Correlation measures in black font refer to all detected DEGs, those in green font only refer to the common set of shared DEGs. D: Heatmap of the 171 commonly detected genes between both conditions showing the relative expression of each gene for each biological replicate compared to the average expression in the control. The righthanded heatmap is a continuation of the left one. Red labels indicate an upregulation, blue labels a downregulation of gene expression. Boxes on top show the conditions (colours) and the replicate (grey). Additionally, the mean LFC values between all biological replicates are depicted on the righthand side for both conditions. Asterixis indicate genes regulated in opposite directions in response to both compounds.
|
