- Title
-
Transcriptomic profiling of tissue environments critical for post-embryonic patterning and morphogenesis of zebrafish skin
- Authors
- Aman, A.J., Saunders, L.M., Carr, A.A., Srivatasan, S., Eberhard, C., Carrington, B., Watkins-Chow, D., Pavan, W.J., Trapnell, C., Parichy, D.M.
- Source
- Full text @ Elife
|
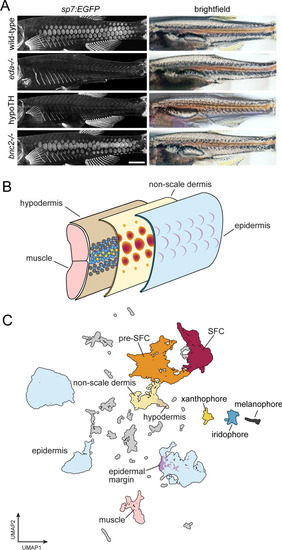
A whole-skin single-cell transcriptome from zebrafish undergoing skin patterning. (A) Confocal images illustrate scale-forming cells (SFCs) expressing sp7:EGFP, and brightfield images of the same fish show pigment pattern. At 9.2 standardized standard length (SSL), approximately 3 wk post fertilization under standard conditions, wild-type zebrafish have all steps of scale development represented and are developing a pigment pattern of dark stripes, with melanophores and sparse iridophores, alternating with light interstripes of densely packed iridophores and yellow xanthophores. Wild-type individuals of 9.6 SSL having precisely four rows of scales were selected for preparation of nuclei to be used in single-cell indexed RNA-seq (sci-RNA-seq); eda mutants and hypoTH fish, devoid of scales, as well as bnc2 mutants having fewer, dysmorphic scales, were likewise reared to 9.6 SSL for isolation of nuclei. (B) Schematic representation of zebrafish skin at 9.2 SSL. The outermost layer of skin is the epidermis (blue), which develops crescent-shaped placodes (epidermal margin, lavender) above each scale. In the dermis (yellow), SFCs differentiate (orange ? red). In the hypodermis (brown), dark melanophores, yellow xanthophores, and iridescent iridophores (gray, yellow, and blue circles, respectively) organize into alternating stripes. (C) UMAP visualization of 35,114 transcriptomes from nuclei of wild-type fish, colored by cell type assignments inferred by marker gene enrichment. Colors correspond to the schematic in (B). Scale bar, 500 mm (A). |
|
Post-embryonic skin morphogenesis. ( |
|
Sci-RNA-seq data quality metrics across backgrounds ( |
|
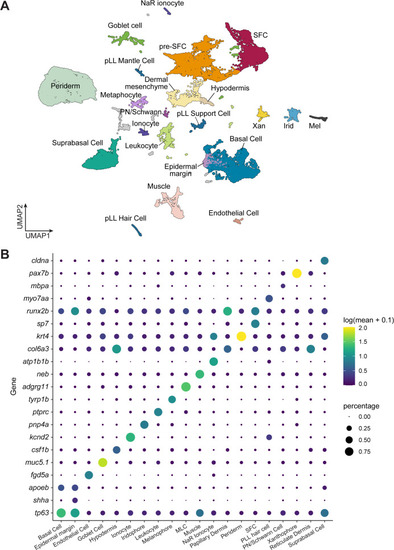
A transcriptome atlas identifies major cell types in post-embryonic skin. ( |
|
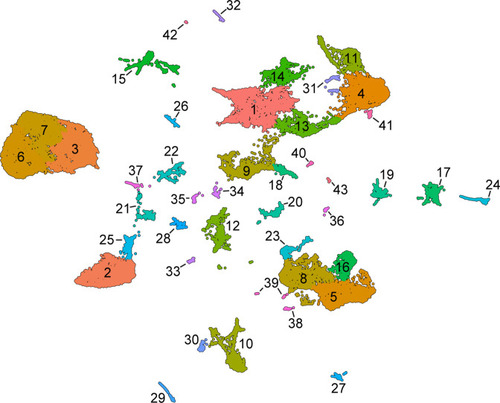
Unsupervised Leiden clustering of wild-type skin cells. This analysis reveals additional, potentially biologically relevant cell states nested within the cell types annotated by analysis of marker genes. |
|
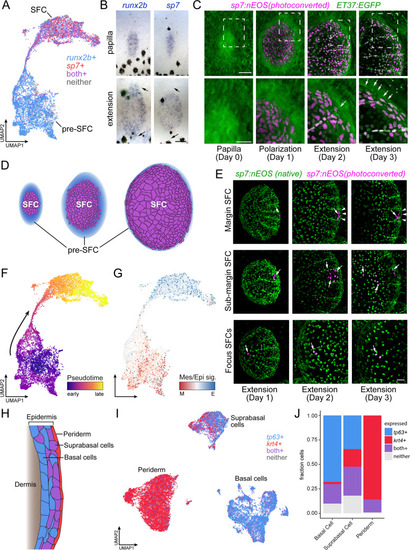
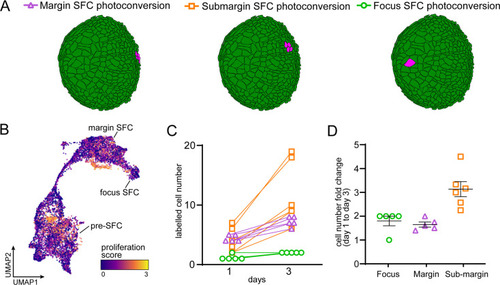
Postembryonic skin cell lineage relationships are not reflected in UMAP space. (A) UMAP visualization showing distribution of differentiated scale-forming cell (SFC) expressing sp7 and pre-SFC progenitors expressing runx2b. (B) In situ hybridization of sp7 and runx2b shows that a halo of pre-SFC progenitors surround the growing scale (arrows). (C) sp7:nEOS-expressing differentiated SFC (magenta) were labeled by photoconversion on day 1. Over the following 2 d, newly differentiated, un-photoconverted SFC appeared at the scale margin (arrows; n = 5 fish). (D) Schematic representation of differentiated SFC (purple) and the associated halo of pre-SFC (blue). (E) Photoconversion of small groups of SFC in the scale margin and sub-margin; and single-cell photoconversion of focus SFCs (arrows) showed that SFC are progressively displaced toward the scale focus and that SFC in all these regions are capable of cell division (arrows, n ? 4 fish for each region tested). Margin SFCs were displaced toward the posterior by newly differentiated, un-photoconverted SFCs (arrowheads). (F) SFCs in UMAP space colored by ?pseudotime? rooted in the SFCs. (G) SFCs in UMAP space colored by the ratio of a mesenchymal (migratory) signature to an epithelial signature (Supplementary file 2?Table 3). (H) Schematic representation of epidermis with major substrata. (I) UMAP visualization of wild-type epidermis, subclustered independently of other cell types and displaying expression of the epidermal basal cell marker tp63 (blue) and the periderm marker krt4 (red). (J) The fraction of cells from panel (H) that pass a minimum threshold for expression of tp63, krt4, or both genes. Scale bars, 50 ?m (B, C, E); 25 ?m, (C, lower). |
|
In situ hybridization using probes against specific transcripts localizes heterogeneous scale-forming cell (SFC) in the developing scale. ( |
|
Scale-forming cell (SFC) lineage and proliferation ( |
|
Evidence for epidermal and dermal contributions to scale plate ECM. ( |
|
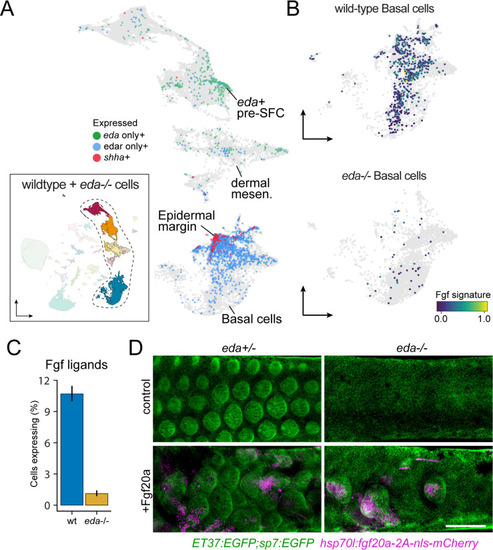
eda and thyroid hormone (TH) regulate signaling ligand transcription in basal epidermal cells ( |
|
eda regulates scale-forming cell (SFC) differentiation via transcriptional regulation of basal epidermal Fgf ligands. ( |
|
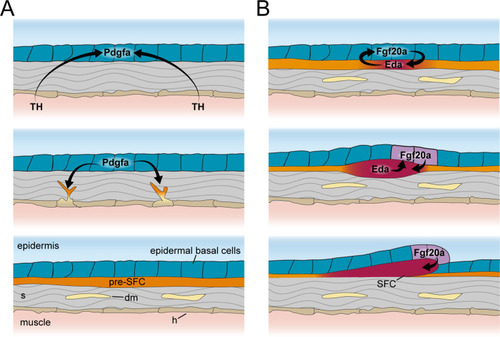
Thyroid hormone (TH) drives dermal stratification via transcriptional regulation of epidermal Pdgf? expression. (A) Differential gene expression analysis between cell types of wild-type and hypoTH fish revealed extensive changes in expression across dermal and epidermal cell types (n = 836 genes, q-value < 0.01, normalized effect >2) (Supplementary file 2?Table 4). SB cell, suprabasal cell. (B) Of the differentially expressed genes, ligands of major signaling pathways involved in morphogenesis are also enriched in basal cells. (C) Both pdgfaa and pdgfab ligands are differentially expressed (***q-value < 1e-10) between wild-type and hypoTH basal cells of the epidermis (error bars estimated via bootstrapping [n = 100]). (D) Wild-type dermal and basal cells of epidermis plotted in UMAP space and colored by whether they express pdgfaa, pdgfab, or both (ligands) as well as pdgfra, pdgfrb, or both (receptors). (E) Upper left: mosaic heat-shock induction of Pdgfaa (magenta), stringently selected for expression in epidermal basal cells, rescued stratification of hypoTH dermis, visualized with ET37:EGFP (green) (n = 65 clones in eight fish). Upper right: higher magnification of boxed area showing accumulation of dermal cells underneath Pdgfaa+ epidermal cells. Bottom: optical cross section of boxed area reveals multiple dermal layers only in proximity to Pdgfaa+ epidermal cells. Scale bars, 50 ?m (E, upper-left panel), 10 ?m (E, enlarged region, upper-right and lower panels). |
|
Excess Pdgfaa expression led to precocious dermal stratification in wild-type and ( |
|
Schematic representation of signaling interactions that regulate dermal morphogenesis. ( |
|
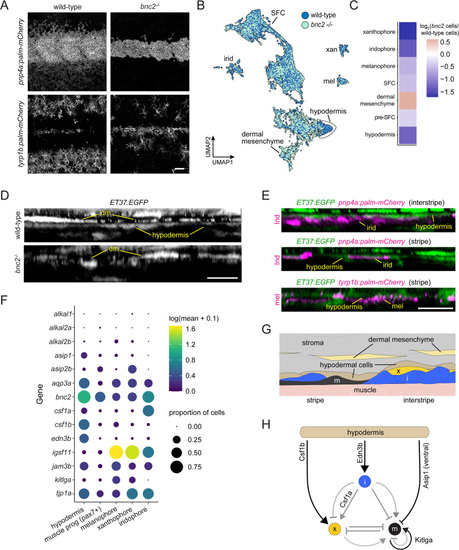
Hypodermis is a pigment cell support cell population. (A) At 9.6 standardized standard length (SSL), bonaparte mutants have grossly fewer iridophores (pnp4a:palm-mCherry) and melanophores (tyrp1b:palm-mCherry). (B) UMAP visualization of dermal cells and pigment cells with wt in blue and bnc2 mutant in red shows specific deficiency in hypodermal cells. (C) Heatmap showing the log2 proportion of dermal cell subtypes and pigment cells. (D) Orthogonal projections of live, super-resolution imaging of dermal cells in wild-type and bnc2 mutants expressing ET37:EGFP. Wild-type hypodermis is a thin, confluent cell layer underneath the more brightly labeled dermal mesenchyme (dm). Stage-matched bnc2 mutant dermis had dermal mesenchyme, but lacked a hypodermal layer. (E) Live imaging of fish doubly transgenic for ET37:EGFP to visualize hypodermis, and pnp4a:palm-mcherry to visualize iridophores (irid) or tyrp1b:palm-mCherry to visualize melanophores (mel). Both pigment cell types reside in close contact with hypodermal cells. (F) Dotplot heatmap showing expression level of known pigment cell trophic factors. (G) Schematic representation of pigment cell microenvironment, greatly expanded along its deep-to-superficial axis to better illustrate organization of the very flat pigment and hypodermal cells. Xanthophore location inferred from Hessle et al., 2013. (H) Potential regulatory linkages between hypodermis and pigment cell types, inferred from expression (black arrows). Previously documented interactions among the pigment cells represented by gray arrows. Scale bars, 100 ?m (A), 10 ?m (D, E). |
|
Hypodermis supports pigment cells. ( |
|
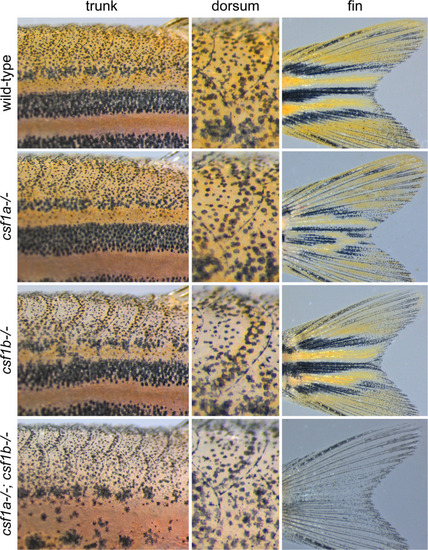
Csf1 requirements for xanthophore pigmentation. Fish that were wild-type (n = 23), homozygous mutant for |

