
Figure 1
- ID
- ZDB-FIG-230916-34
- Publication
- Aman et al., 2023 - Transcriptomic profiling of tissue environments critical for post-embryonic patterning and morphogenesis of zebrafish skin
- Other Figures
-
- Figure 1
- Figure 1—figure supplement 1.
- Figure 1—figure supplement 2.
- Figure 1—figure supplement 3.
- Figure 1—figure supplement 4.
- Figure 2
- Figure 2—figure supplement 1.
- Figure 2—figure supplement 2.
- Figure 3.
- Figure 4.
- Figure 5.
- Figure 6—figure supplement 1.
- Figure 6—figure supplement 1.
- Figure 7.
- Figure 8
- Figure 8—figure supplement 1.
- Figure 8—figure supplement 2.
- All Figure Page
- Back to All Figure Page
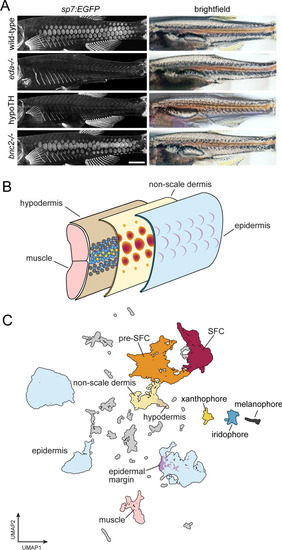
A whole-skin single-cell transcriptome from zebrafish undergoing skin patterning. (A) Confocal images illustrate scale-forming cells (SFCs) expressing sp7:EGFP, and brightfield images of the same fish show pigment pattern. At 9.2 standardized standard length (SSL), approximately 3 wk post fertilization under standard conditions, wild-type zebrafish have all steps of scale development represented and are developing a pigment pattern of dark stripes, with melanophores and sparse iridophores, alternating with light interstripes of densely packed iridophores and yellow xanthophores. Wild-type individuals of 9.6 SSL having precisely four rows of scales were selected for preparation of nuclei to be used in single-cell indexed RNA-seq (sci-RNA-seq); eda mutants and hypoTH fish, devoid of scales, as well as bnc2 mutants having fewer, dysmorphic scales, were likewise reared to 9.6 SSL for isolation of nuclei. (B) Schematic representation of zebrafish skin at 9.2 SSL. The outermost layer of skin is the epidermis (blue), which develops crescent-shaped placodes (epidermal margin, lavender) above each scale. In the dermis (yellow), SFCs differentiate (orange → red). In the hypodermis (brown), dark melanophores, yellow xanthophores, and iridescent iridophores (gray, yellow, and blue circles, respectively) organize into alternating stripes. (C) UMAP visualization of 35,114 transcriptomes from nuclei of wild-type fish, colored by cell type assignments inferred by marker gene enrichment. Colors correspond to the schematic in (B). Scale bar, 500 mm (A). |