
|
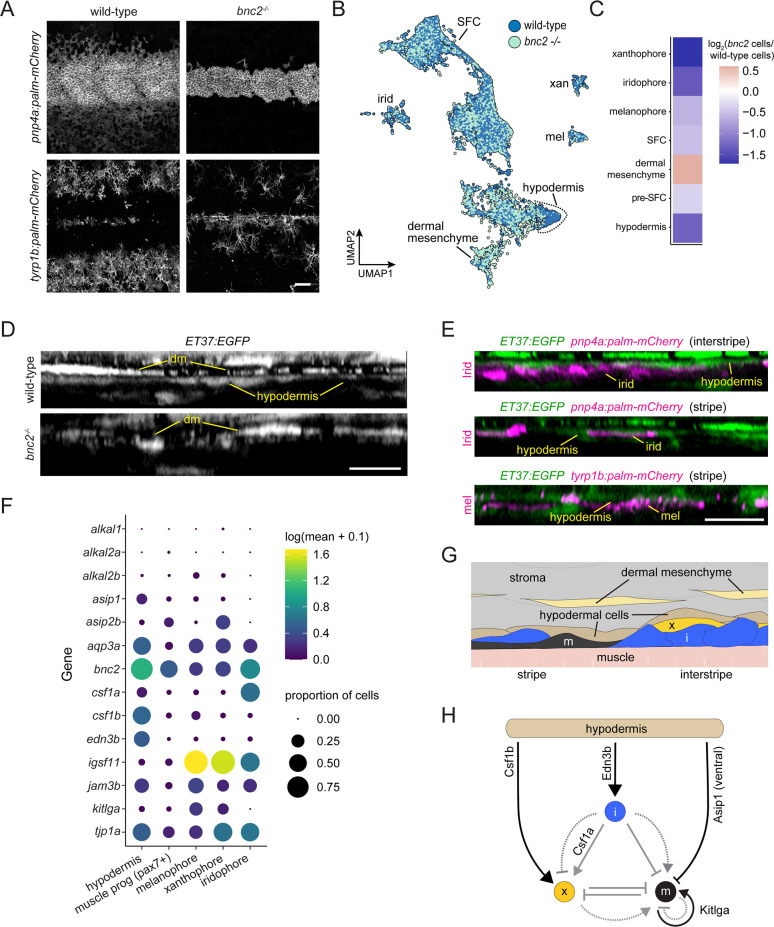
Figure 8 Hypodermis is a pigment cell support cell population. (A) At 9.6 standardized standard length (SSL), bonaparte mutants have grossly fewer iridophores (pnp4a:palm-mCherry) and melanophores (tyrp1b:palm-mCherry). (B) UMAP visualization of dermal cells and pigment cells with wt in blue and bnc2 mutant in red shows specific deficiency in hypodermal cells. (C) Heatmap showing the log2 proportion of dermal cell subtypes and pigment cells. (D) Orthogonal projections of live, super-resolution imaging of dermal cells in wild-type and bnc2 mutants expressing ET37:EGFP. Wild-type hypodermis is a thin, confluent cell layer underneath the more brightly labeled dermal mesenchyme (dm). Stage-matched bnc2 mutant dermis had dermal mesenchyme, but lacked a hypodermal layer. (E) Live imaging of fish doubly transgenic for ET37:EGFP to visualize hypodermis, and pnp4a:palm-mcherry to visualize iridophores (irid) or tyrp1b:palm-mCherry to visualize melanophores (mel). Both pigment cell types reside in close contact with hypodermal cells. (F) Dotplot heatmap showing expression level of known pigment cell trophic factors. (G) Schematic representation of pigment cell microenvironment, greatly expanded along its deep-to-superficial axis to better illustrate organization of the very flat pigment and hypodermal cells. Xanthophore location inferred from Hessle et al., 2013. (H) Potential regulatory linkages between hypodermis and pigment cell types, inferred from expression (black arrows). Previously documented interactions among the pigment cells represented by gray arrows. Scale bars, 100 μm (A), 10 μm (D, E).