Image
Figure Caption

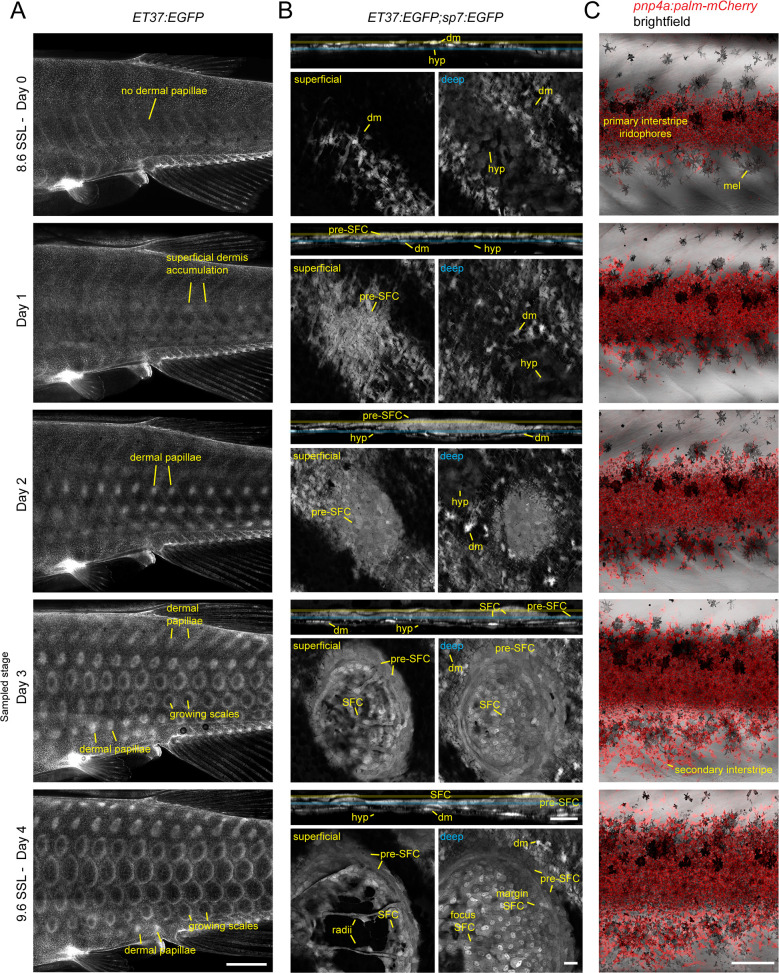
Figure 1—figure supplement 1. Post-embryonic skin morphogenesis.

(A) Overview of dermal development between 8.6 and 9.6 standardized standard length (SSL), visualized by imaging fish transgenic for ET37:EGFP, which labels most dermal cells (Aman et al., 2021; Parichy et al., 2009). Morphology on day 3 of this series corresponds to the stage at which fish were selected for skin dissection and isolation of nuclei. (B) Development of an individual scale in ET37:EGFP;sp7:EGFP double transgenics. Each timepoint shows an orthogonal projection through the entire dermis above single confocal slices of superficial dermis (yellow) and deep dermis (blue). (C) Stripe and interstripe reiteration occurs during the same timeframe, with secondary interstripe initiation occurring at the sampled stage. Each series was made by repeated imaging of individual specimens. hyp, hypodermis; dm, dermal mesenchyme; mel, melanophore. Scale bars, 1 mm (A), 10 µm (B), 500 µm (C).

Acknowledgments
This image is the copyrighted work of the attributed author or publisher, and ZFIN has permission only to display this image to its users. Additional permissions should be obtained from the applicable author or publisher of the image. Full text @ Elife