Image
Figure Caption

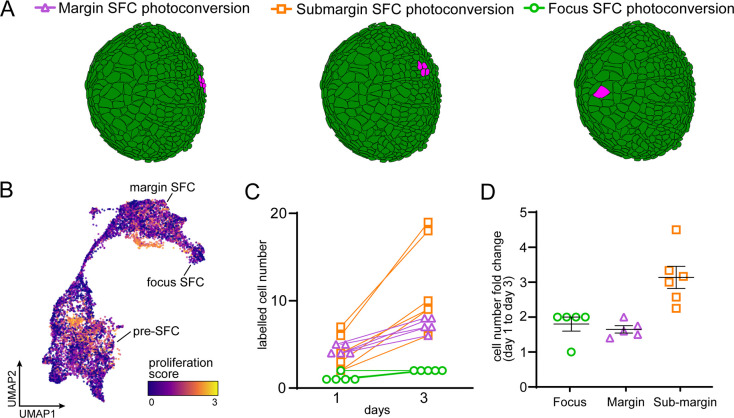
Figure 2—figure supplement 2. Scale-forming cell (SFC) lineage and proliferation

(A) Schematic representation of photoconversion experiments in (Figure 3C) showing representative photoconversion regions. (B) UMAP visualization of transcripts associated with high rates of cell proliferation. (C) The number of labeled cells increased in every specimen examined. (D) Fold change of labeled cell number (mean ± SEM) over 2 d of scale growth (margin and submargin, n = 5 each; focus n = 6).

Acknowledgments
This image is the copyrighted work of the attributed author or publisher, and ZFIN has permission only to display this image to its users. Additional permissions should be obtained from the applicable author or publisher of the image. Full text @ Elife