
- Title
-
Cholesteryl hemiazelate Identified in Cardiovascular Disease Patients Causes in vitro and in vivo Inflammation
- Authors
- Domingues, N., Gaifem, J., Matthiesen, R., Saraiva, D.P., Bento, L., Marques, A.R.A., Soares, M.I.L., Sampaio, J., Klose, C., Surma, M.A., Almeida, M.S., Rodrigues, G., Gonçalves, P.A., Ferreira, J., E Melo, R.G., Pedro, L.M., Simons, K., Pinho E Melo, T.M.V.D., Cabral, M.G., Jacinto, A., Silvestre, R., Vaz, W., Vieira, O.V.
- Source
- Full text @ J. Lipid Res.
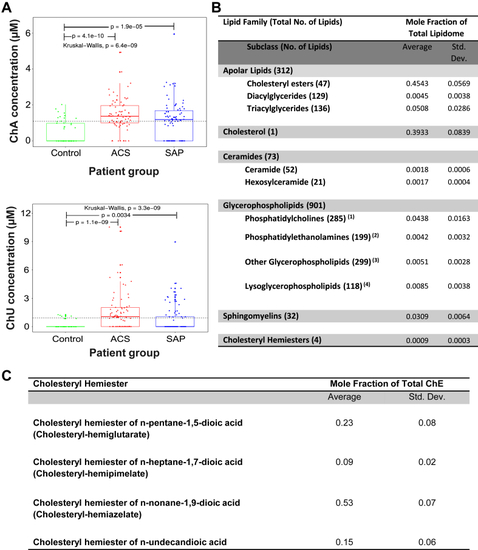
ChA levels are increased in plasma of CVD patients. Boxplots depicting ChA and ChE of 1,11-undecendioic acid (ChU) concentrations across patient groups. A: Kruskal–Wallis one-way analysis of variance was applied to test whether ChA concentration across samples originates from the same distribution. Unpaired two-sample Wilcoxon test was applied as a post hoc test to evaluate significant differences in lipid levels for a patient group versus the control group (indicated by “p”). The horizontal black dashed line indicates the global mean across all samples. Plasma concentration of ChA was obtained by shotgun lipidomics of 74 donors with ACS (including ST-elevation and non-ST-elevation myocardial infarction and unSAP), 71 donors with SAP, and 52 age-matched control cohort. ChA was quantitatively analyzable in 34.6% of the control group, 69% of the SAP group, and 83.8% of the ACS group. B: Lipidomes of the atheromata obtained from six different carotid artery endarterectomy specimens. |
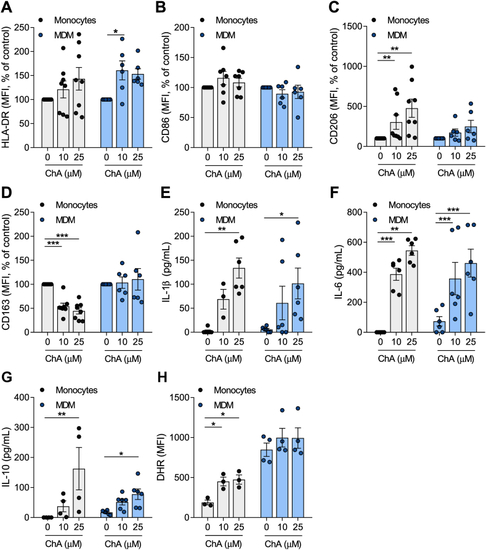
ChA changes the expression of surface markers and the inflammatory profile of human primary monocytes (Mono) and MDMs. Peripheral blood was harvested from human volunteers. Mononuclear leukocytes (peripheral blood mononuclear cells) were isolated from whole blood using histopaque-1077. CD14+ cells were purified from total peripheral blood mononuclear cells by immunomagnetic separation. CD14+ monocytes were cultured in the presence of ChA (10 μM or 25 μM) or vehicle for 24 h (eight different donors) or for 7 days to obtain MDM (six different donors). Monocytes were differentiated using rM-CSF. After lipid treatment, a representative sample of cells was stained with monoclonal antibodies to determine surface expression of HLA-DR (A), CD86 (B), CD206 (C), and CD163 (D); data represent the mean fluorescence intensity (MFI) ± SEM for all subjects normalized to the control cells. Cell culture supernatants were analyzed by ELISA for IL-1β (E), IL-6 (F), and IL-10 release (G). Values represent the mean ± SEM of cytokine released (in pg/ml). Reactive oxygen species production by monocytes and MDM exposed to ChA (H). ∗ |
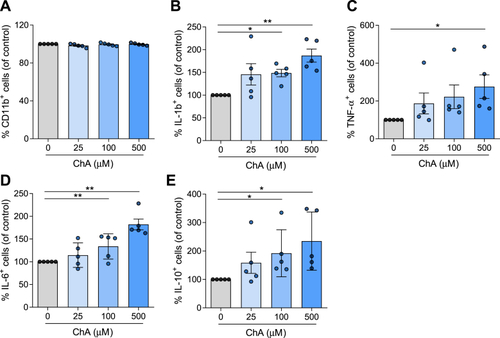
ChA affects the cytokine profile of neutrophils. Neutrophils were harvested from human volunteers (five different donors) using a gradient with histopaque-1177 and 1009. Cells were cultured in the presence of ChA (25, 100, and 500 μM) or vehicle for 4 h. After treatment, neutrophils were stained with monoclonal antibodies to determine the expression of CD11b (A) and cytokines: IL-1β (B), TNF-α (C), IL-6 (D), and IL-10 (E); data represent the percentage of positive cells for each inflammatory marker normalized to the control cells. ∗ |
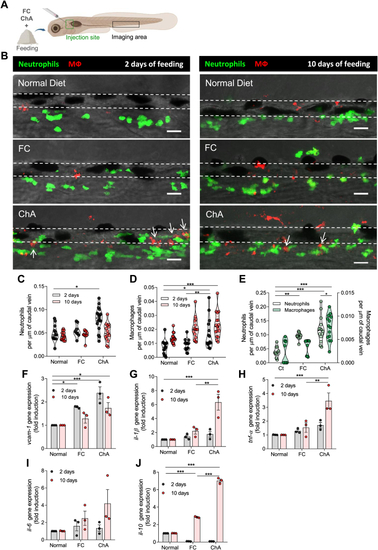
ChA induces infiltration of neutrophils and macrophages in zebrafish caudal vein. A: Schematic representation indicating with rectangles the sites of lipid microinjection and imaging. B: Representative images of the caudal vein of Tg ( |
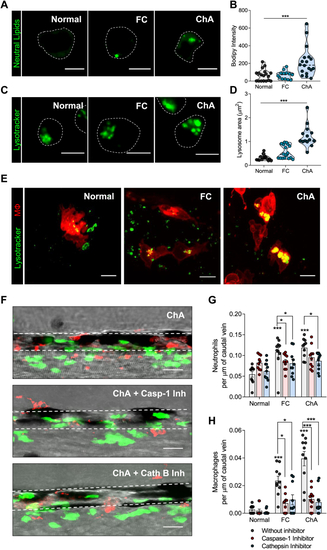
Inflammasome and cathepsin-B inhibition decrease ChA-induced myeloid cell infiltration. A–D: Zebrafish larvae were fed for 10 days with normal, 4% FC-enriched, or 3% ChA-enriched diets, and macrophages were isolated by fluorescence-activated cell sorting (FACS). A: Representative confocal images of macrophages stained with BODIPY 493/503 to visualize neutral lipids. B: Quantification of neutral lipid accumulation on isolated macrophages. C: Representative confocal images of macrophages stained with LysoTracker to visualize lysosomes/acidic organelles. Scale bars represent 5 μm. D: Quantification of the lysosome area on isolated macrophages. In B and D, the results are the mean ± SEM of two independent experiments (at least 10 cells were analyzed per condition); ∗∗∗ |
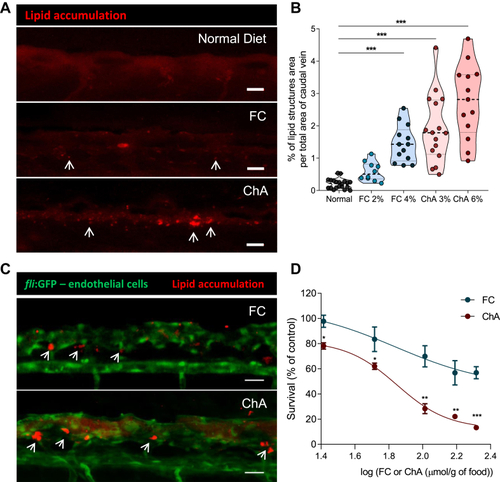
ChA induces lipid accumulation in the vasculature and is toxic to zebrafish larvae. Five days postfertilization, zebrafish larvae were fed for 10 days with normal (in gray), FC-enriched (in blue), or ChA-enriched (in red) diets. A: Confocal z-projection images of fluorescent lipid deposits (in red, indicated by the arrows) of caudal vein of AB larvae. For visualization of lipid structures, diets (normal, 2 or 4% FC-enriched, 3 or 6% ChA-enriched food) were supplemented with 10 μg/g of a red fluorescent CE. Scale bars represent 20 μm. B: Quantification of total lipid structure area in the zebrafish caudal vein. Fluorescent images of at least 10 larvae were quantified per condition. The results are shown as mean ± SEM; ∗∗∗ |
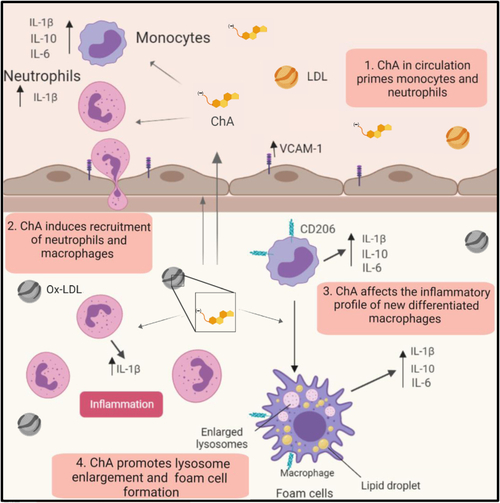
Working model of the proatherogenic properties of ChA. ChA is an end product of cholesteryl linoleate oxidation, generated in the arterial intima. Because of its amphiphilic properties, ChA can be detected in the plasma of CVD patients. The presence of ChA in circulation can imprint an inflammatory phenotype in the circulating monocytes and neutrophils (1), conditioning the immunological response in the arterial intima. ChA promotes the recruitment of innate immune cells, neutrophils, and monocytes into the vasculature (2). Here, neutrophils in the presence of ChA secret IL-1β, which can interfere with monocyte/macrophage priming. Monocytes differentiated in the presence of ChA are activated, increasing the secretion of inflammatory cytokines: IL-1β, IL-6, and IL-10 (3). In activated macrophages, ChA induces lipid accumulation (foam cells) and lysosomal dysfunction, conferring then the second signal necessary for IL-1β secretion mediated by inflammasome activation (4). IL-1β can initiate a propagation loop of the inflammation, increasing the macrophage secretion of IL-6 and TNF-α. On the other hand, dysfunctional lysosomes will decrease the clearance capacity of macrophages, leading to lipid accumulation in the arterial intima. |