IMAGE

Fig. 6

ID
ZDB-IMAGE-230828-94
Source
Figures for Domingues et al., 2023
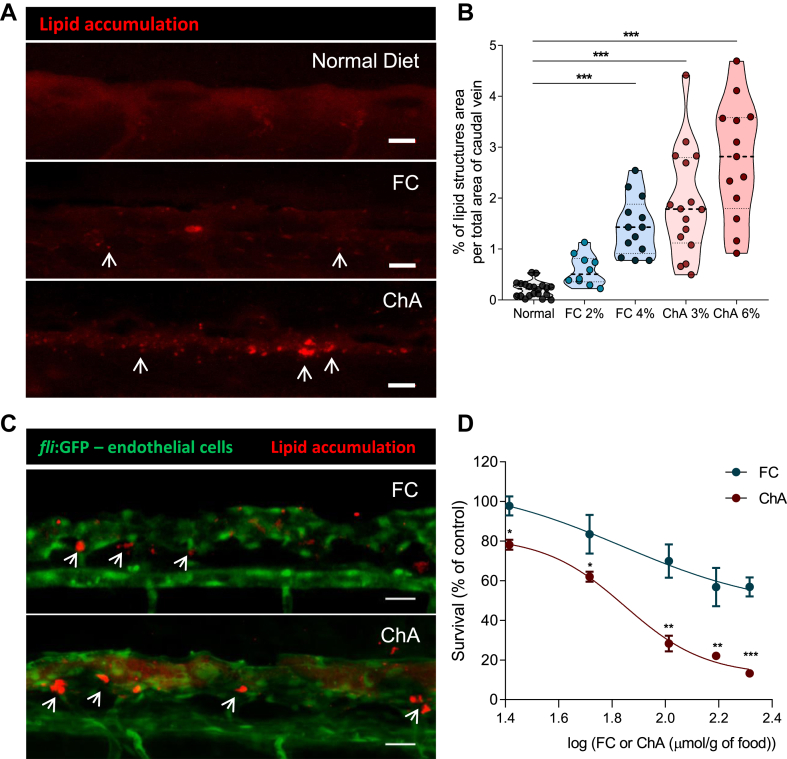
Image
Figure Caption

Fig. 6

ChA induces lipid accumulation in the vasculature and is toxic to zebrafish larvae. Five days postfertilization, zebrafish larvae were fed for 10 days with normal (in gray), FC-enriched (in blue), or ChA-enriched (in red) diets. A: Confocal z-projection images of fluorescent lipid deposits (in red, indicated by the arrows) of caudal vein of AB larvae. For visualization of lipid structures, diets (normal, 2 or 4% FC-enriched, 3 or 6% ChA-enriched food) were supplemented with 10 μg/g of a red fluorescent CE. Scale bars represent 20 μm. B: Quantification of total lipid structure area in the zebrafish caudal vein. Fluorescent images of at least 10 larvae were quantified per condition. The results are shown as mean ± SEM; ∗∗∗P < 0.001 using one-way ANOVA with Dunnett’s multiple comparisons test. C: Z-projection of the caudal vein of fli1:EGFP larvae fed as above. Green fluorescence corresponds to endothelial cells (ECs), and red fluorescence corresponds to deposits of lipids localized at the bifurcation sites (arrows). Scale bars represent 20 μm. D: Evaluation of larvae survival as a function of FC (in blue) or ChA (in red) concentration in the diet. Lipid concentration is given by logarithm of 26 μmol/g of food (FC 1%, ChA 1.5%), 52 μmol/g of food (FC 2%, ChA 3%), 103 μmol/g of food (FC 4%, ChA 6%), 155 μmol/g of food (FC 6%, ChA 9%), and 207 μmol/g of food (FC 8%, ChA 12%). Results are mean of two independent experiments (each experiment with 40 larvae). The error bars indicate the SEM and ∗∗P < 0.01; ∗∗∗P < 0.001 using one-way ANOVA with Tukey’s multiple comparisons test.

Acknowledgments
This image is the copyrighted work of the attributed author or publisher, and ZFIN has permission only to display this image to its users. Additional permissions should be obtained from the applicable author or publisher of the image. Full text @ J. Lipid Res.