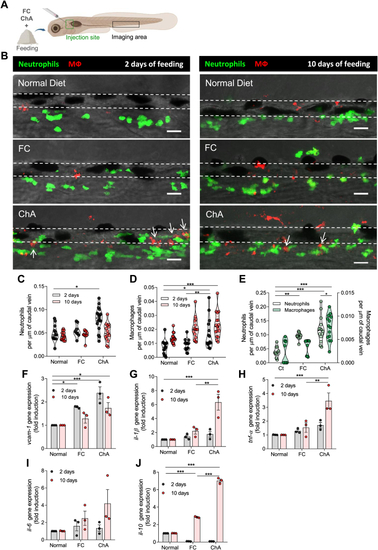
ChA induces infiltration of neutrophils and macrophages in zebrafish caudal vein. A: Schematic representation indicating with rectangles the sites of lipid microinjection and imaging. B: Representative images of the caudal vein of Tg (mpeg.mCherryCAAX SH378, mpx:EGFP i114) zebrafish larvae fed for 2 or 10 days with normal, FC (4% [w/w] 103 μmol per g of food, positive control), or ChA (3% [w/w], 52 μmol per g of food)-enriched diets and imaged by confocal microscopy. The feeding started at 5 days postfertilization. Images are Z-stacks of fluorescent green (neutrophils) and red (macrophages) cells and the respective bright field. Arrows point to neutrophils and macrophages that are in the close proximity. Dashed lines delineate the caudal vein. Scale bars represent 20 μm. C and D, quantification of neutrophils (green cells, C) and macrophages (red cells, D) after 2 (gray color) or 10 days of feeding (red color). Infiltration of neutrophils occurs earlier than macrophages. The results are shown as mean ± SEM of three independent experiments (in each independent experiment, at least five larvae were analyzed per condition). E: Recruitment of neutrophils (gray color) and macrophages (green color) into the vasculature of Tg (mpeg.mCherryCAAX SH378, mpx:EGFP i114) larvae 24 h after the microinjection of POPC (27 μM, vehicle, Ct), FC:POPC (50 μM FC), and ChA:POPC liposomes (50 μM ChA). The graphs represent the mean ± SEM of three independent experiments (at least three larvae in each independent experience were analyzed in each condition). F–J: Quantitative RT-PCR for vcam-1 (F), il-1β (G), tnf-α (H), il-6 (I), and il-10 (J) after 2 or 10 days of feeding with normal, FC-enriched, or ChA-enriched diets. The values represent the mean ± SEM normalized to the control of three independent experiments (n = 20–30 zebrafish larvae per group); ∗P < 0.05 ∗∗p ˂ 0.01; ∗∗∗P < 0.001 using one-way ANOVA with Dunnett’s multiple comparisons test.
|
