FIGURE

Fig. 5

ID
ZDB-FIG-230828-96
Publication
Domingues et al., 2023 - Cholesteryl hemiazelate Identified in Cardiovascular Disease Patients Causes in vitro and in vivo Inflammation
Other Figures
All Figure Page
Back to All Figure Page
Fig. 5

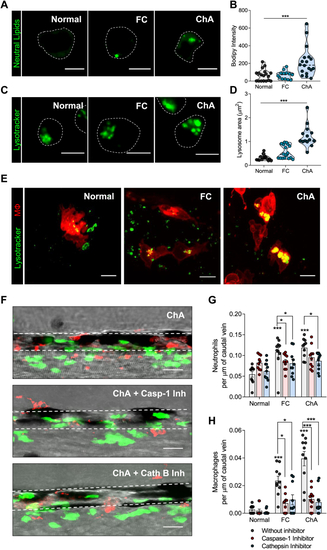
Inflammasome and cathepsin-B inhibition decrease ChA-induced myeloid cell infiltration. A–D: Zebrafish larvae were fed for 10 days with normal, 4% FC-enriched, or 3% ChA-enriched diets, and macrophages were isolated by fluorescence-activated cell sorting (FACS). A: Representative confocal images of macrophages stained with BODIPY 493/503 to visualize neutral lipids. B: Quantification of neutral lipid accumulation on isolated macrophages. C: Representative confocal images of macrophages stained with LysoTracker to visualize lysosomes/acidic organelles. Scale bars represent 5 μm. D: Quantification of the lysosome area on isolated macrophages. In B and D, the results are the mean ± SEM of two independent experiments (at least 10 cells were analyzed per condition); ∗∗∗P < 0.001 using one-way ANOVA with Dunnett’s multiple comparisons test. E: In vivo lysosomal imaging of macrophages (m-Cherry) from larvae fed with different diets. Lysosomes were stained with LysoTracker (green). Scale bars represent 5 μm. F–H: Effect of caspase 1 (Casp-1) and cathepsin B (Cath B) inhibitors on neutrophils and macrophage infiltration into the caudal vein of Tg (mpeg.mCherryCAAX SH378, mpx:EGFP i114) zebrafish larvae fed with normal, 10% FC-enriched, or 14% ChA-enriched food. F: Representative confocal images. Images are Z-stacks of fluorescent green (neutrophils) and red (macrophages) cells and the respective bright fields. Dashed lines delineate the caudal vein. Scale bars represent 20 μm. G and H: Quantification of Casp-1 and Cath B inhibitors on neutrophil (G) and macrophage (H) infiltration into the caudal vein. Three independent experiments were performed, and at least three larvae were analyzed per experiment (total of >10 larvae per condition); ∗P < 0.05; ∗∗∗P < 0.001 using two-way ANOVA with Dunnett’s multiple comparisons test.

Expression Data

Expression Detail
Antibody Labeling
Phenotype Data

Phenotype Detail
Acknowledgments
This image is the copyrighted work of the attributed author or publisher, and ZFIN has permission only to display this image to its users. Additional permissions should be obtained from the applicable author or publisher of the image. Full text @ J. Lipid Res.