
- Title
-
Minichromosome maintenance protein 10 (mcm10) regulates hematopoietic stem cell emergence in the zebrafish embryo
- Authors
- Cacialli, P., Dogan, S., Linnerz, T., Pasche, C., Bertrand, J.Y.
- Source
- Full text @ Stem Cell Reports
mcm10 is expressed in the hemogenic endothelium (A) WISH for mcm10 at different stages of zebrafish embryonic development (24–36 hpf). (B) Double WISH for mcm10/runx1 at 26 hpf. (C) Experimental outline of qPCR analysis after dissection of heads, trunks, and tails from 26 hpf flk1:GFP transgenic animals (around 50 embryos), comparing with whole embryos. Data represent biological triplicates plated in technical duplicates. Statistical analysis was completed using one-way ANOVA, multiple comparison test. ∗∗p < 0.01; ∗∗∗p < 0.001; ∗∗∗∗p < 0.0001. Scale bars: 200 μm (A), 100 μm (B). |
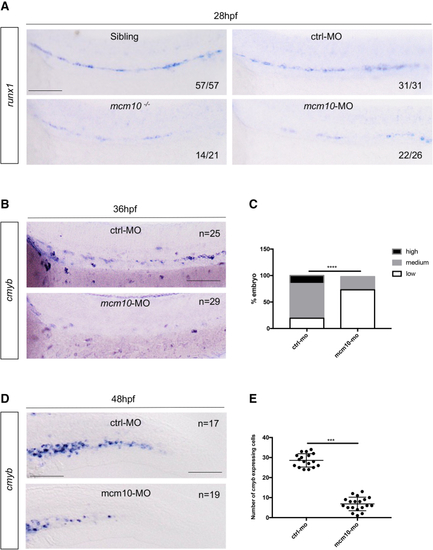
The loss of (A) WISH for (B) WISH for (C) Statistical analysis was completed using Fisher’s exact test, ∗∗∗∗p < 0.0001 (n = number of total embryos from three independent experiments). (D) WISH for (E) Statistical analysis was completed using unpaired two-tailed t test, ∗∗∗p < 0.001 (n = number of total embryos from three independent experiments). Scale bars: 100 μm (A, B, and D). |
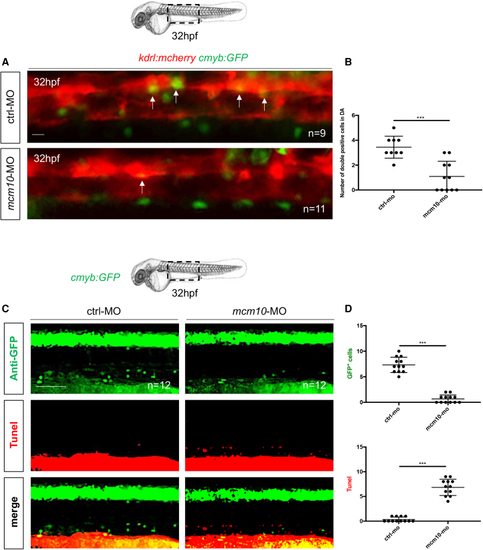
(A) Fluorescence imaging of the dorsal aorta in (B) Quantification of HSCs. Statistical analysis: unpaired two-tailed t test, ∗∗∗p < 0.001 (n = number of total embryos from three independent experiments). (C) Anti-GFP and TUNEL stainings of (D) Quantification of the number of GFP+ and TUNEL+ cells in control and PHENOTYPE:
|
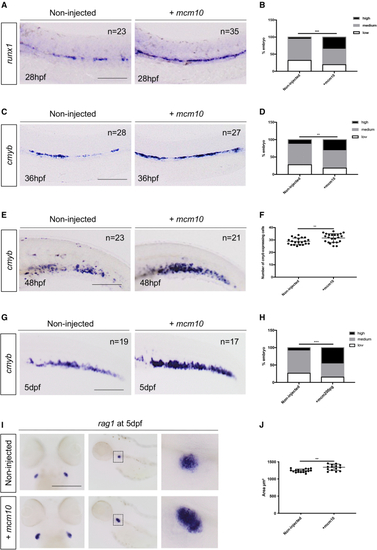
(A) (B) Statistical analysis was completed using Fisher’s exact test. ∗∗∗p < 0.001 (n = number of total embryos from three independent experiments). (C) WISH against (D) Statistical analysis was completed using Fisher’s exact test. ∗∗p < 0.01 (n = number of total embryos from three independent experiments). (E) (F) Quantification of the number of (G) WISH against (H) Statistical analysis was completed using Fishers exact test. ∗∗∗p < 0.001. (I) WISH against (J) The area of the thymus was measured for each embryo. Statistical analysis was completed using an unpaired two-tailed t test. ∗∗p < 0.01 (n = number of total embryos from three independent experiments). Scale bars: 100 μm (A, C, E, G, and I). |
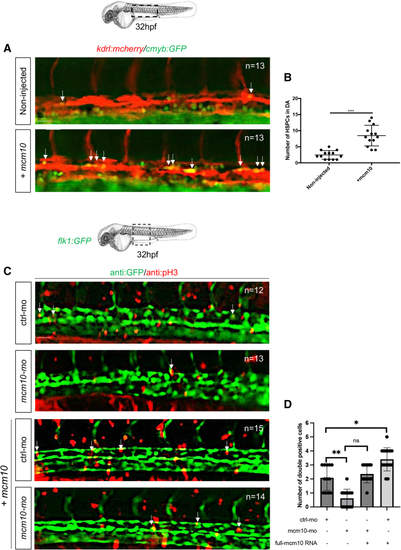
(A) Fluorescence imaging of dorsal aorta in 32-hpf (B) The number of double-positive cells was reported for each condition. Statistical analysis was completed using an unpaired two-tailed t test. ∗∗∗p < 0.0001. Center values denote the mean, and error values denote SEM (n = number of total embryos from three independent experiments). (C) An immunofluorescence against GFP and phospho-histone 3 (pH3) was performed on 32-hpf PHENOTYPE:
|
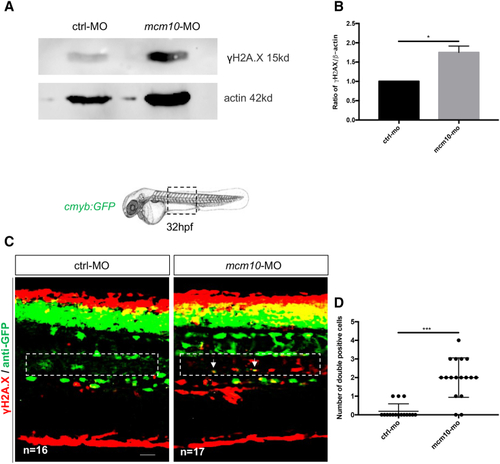
(A) Western blot to quantify γH2A.X in control or (B) Statistical analysis of the ratio γH2A.X/actin was completed using an unpaired two-tailed t test. ∗p < 0.01 (three independent experiments, with >30 embryos pooled per condition, per experiment). (C) Anti-GFP and γH2A.X stainings performed on 32-hpf (D) Quantification of the number of double-positive cells in the aorta floor of control and PHENOTYPE:
|
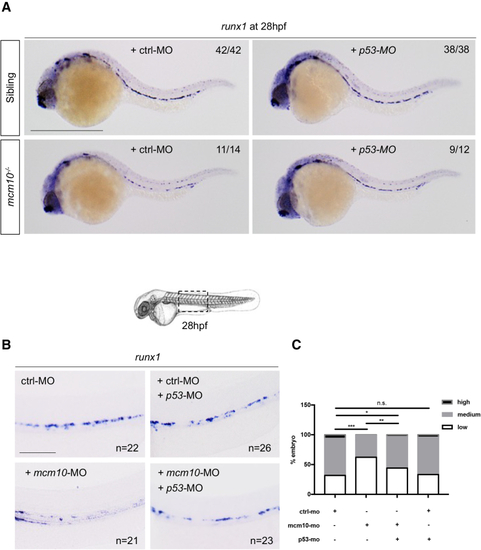
(A) (B) (C) Statistical analysis was completed using Fisher’s exact test. ∗p < 0.01; ∗∗p < 0.001; ∗∗∗p < 0.0001 (n = number of total embryos from three independent experiments). Scale bars: 200 μm (A), 100 μm (B). |

ZFIN is incorporating published figure images and captions as part of an ongoing project. Figures from some publications have not yet been curated, or are not available for display because of copyright restrictions. EXPRESSION / LABELING:
|
|
ZFIN is incorporating published figure images and captions as part of an ongoing project. Figures from some publications have not yet been curated, or are not available for display because of copyright restrictions. |