
Figure 4
- ID
- ZDB-IMAGE-230724-50
- Publication
- Cacialli et al., 2023 - Minichromosome maintenance protein 10 (mcm10) regulates hematopoietic stem cell emergence in the zebrafish embryo
- All Figures
- Figures for Cacialli et al., 2023
|
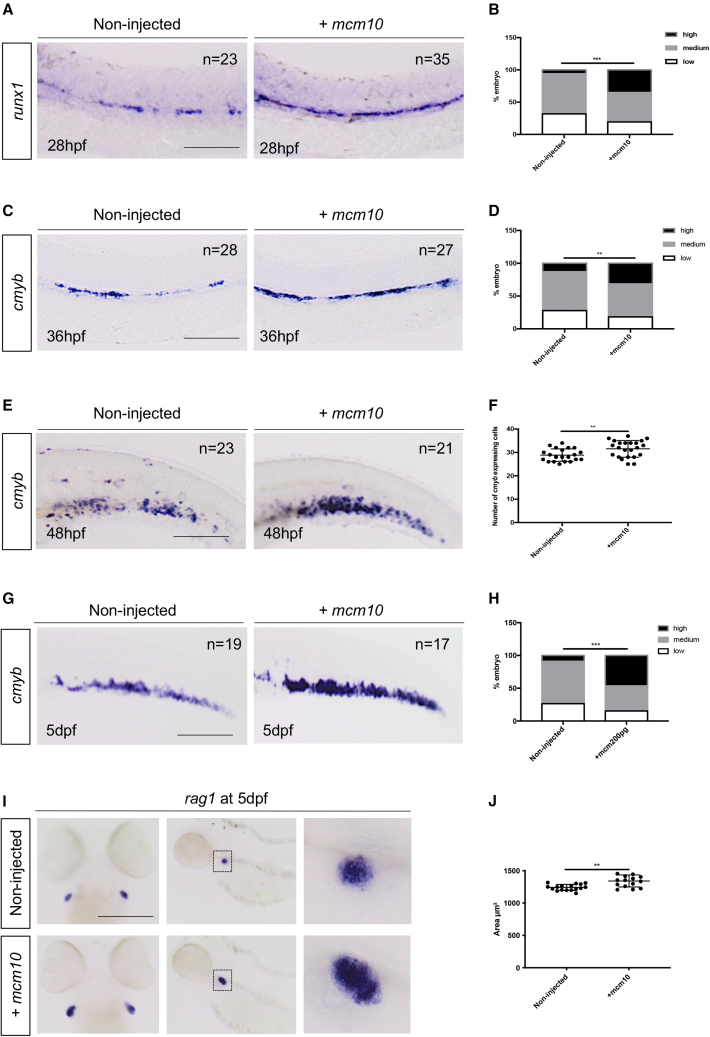
Figure 4
(A)
(B) Statistical analysis was completed using Fisher’s exact test. ∗∗∗p < 0.001 (n = number of total embryos from three independent experiments).
(C) WISH against
(D) Statistical analysis was completed using Fisher’s exact test. ∗∗p < 0.01 (n = number of total embryos from three independent experiments).
(E)
(F) Quantification of the number of
(G) WISH against
(H) Statistical analysis was completed using Fishers exact test. ∗∗∗p < 0.001.
(I) WISH against
(J) The area of the thymus was measured for each embryo. Statistical analysis was completed using an unpaired two-tailed t test. ∗∗p < 0.01 (n = number of total embryos from three independent experiments). Scale bars: 100 μm (A, C, E, G, and I).