
Figure 5
- ID
- ZDB-IMAGE-230724-51
- Publication
- Cacialli et al., 2023 - Minichromosome maintenance protein 10 (mcm10) regulates hematopoietic stem cell emergence in the zebrafish embryo
- All Figures
- Figures for Cacialli et al., 2023
|
Figure 5
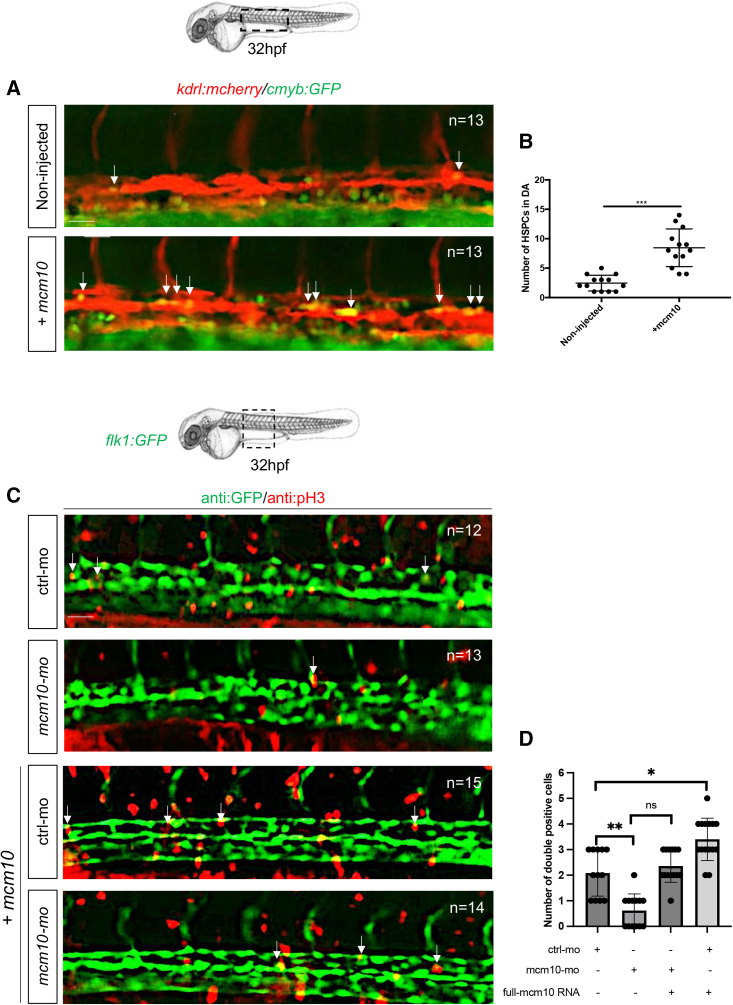
(A) Fluorescence imaging of dorsal aorta in 32-hpf
(B) The number of double-positive cells was reported for each condition. Statistical analysis was completed using an unpaired two-tailed t test. ∗∗∗p < 0.0001. Center values denote the mean, and error values denote SEM (n = number of total embryos from three independent experiments).
(C) An immunofluorescence against GFP and phospho-histone 3 (pH3) was performed on 32-hpf