
Figure 6
- ID
- ZDB-IMAGE-230724-52
- Publication
- Cacialli et al., 2023 - Minichromosome maintenance protein 10 (mcm10) regulates hematopoietic stem cell emergence in the zebrafish embryo
- All Figures
- Figures for Cacialli et al., 2023
|
Figure 6
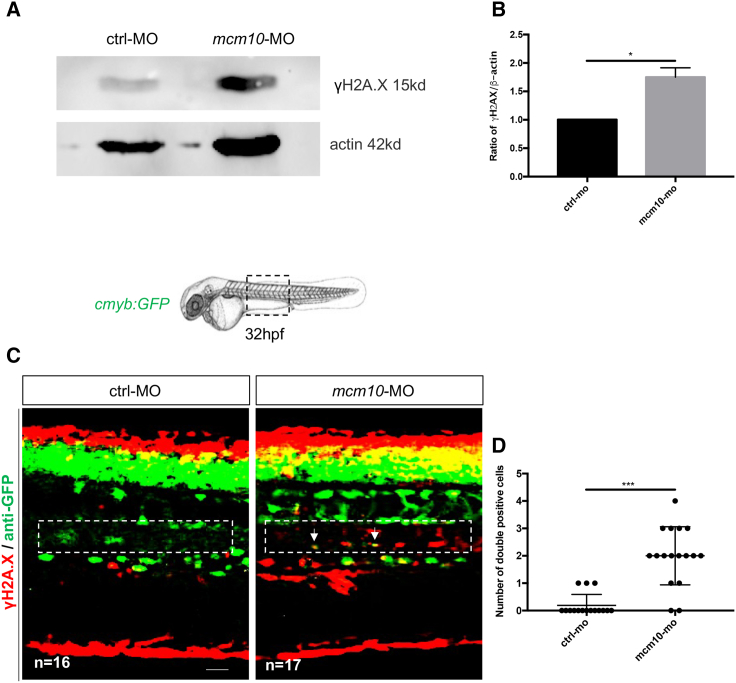
(A) Western blot to quantify γH2A.X in control or
(B) Statistical analysis of the ratio γH2A.X/actin was completed using an unpaired two-tailed t test. ∗p < 0.01 (three independent experiments, with >30 embryos pooled per condition, per experiment).
(C) Anti-GFP and γH2A.X stainings performed on 32-hpf
(D) Quantification of the number of double-positive cells in the aorta floor of control and