IMAGE

Figure 3

ID
ZDB-IMAGE-230724-49
Source
Figures for Cacialli et al., 2023
Image
Figure Caption

Figure 3

mcm10 deficiency induces apoptosis in developing HSCs

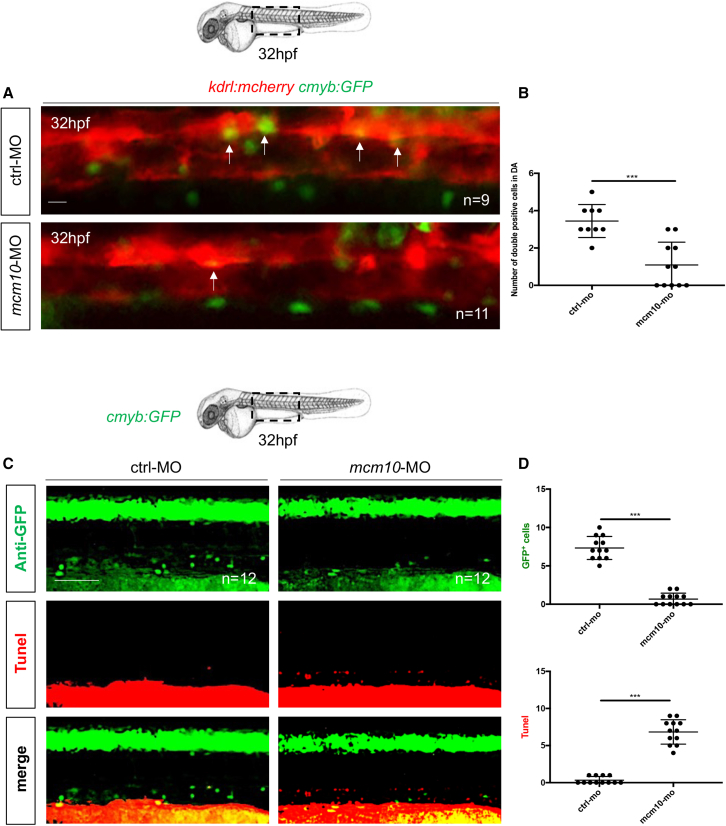
(A) Fluorescence imaging of the dorsal aorta in flk1:mCherry;cmyb:GFP embryos injected with control or mcm10-MOs.

(B) Quantification of HSCs. Statistical analysis: unpaired two-tailed t test, ∗∗∗p < 0.001 (n = number of total embryos from three independent experiments).

(C) Anti-GFP and TUNEL stainings of cmyb:GFP embryos at 32 hpf, after injection of either control or mcm10 morpholinos (mcm10-MO).

(D) Quantification of the number of GFP+ and TUNEL+ cells in control and mcm10-morphants. Center values denote the mean, error values denote SEM, and statistical analysis was completed using an unpaired two-tailed t test. ∗∗∗p < 0.001 (n = number of total embryos from three independent experiments). Scale bars: 50 μm (A), 100 μm (C).

Acknowledgments
This image is the copyrighted work of the attributed author or publisher, and ZFIN has permission only to display this image to its users. Additional permissions should be obtained from the applicable author or publisher of the image. Full text @ Stem Cell Reports