- Title
-
Serotonin/5-HT7 receptor provides an adaptive signal to enhance pigmentation response to environmental stressors through cAMP-PKA-MAPK, Rab27a/RhoA, and PI3K/AKT signaling pathways
- Authors
- Tang, H.H., Zhang, Y.F., Yang, L.L., Hong, C., Chen, K.X., Li, Y.M., Wu, H.L.
- Source
- Full text @ FASEB J.
|
Effects of 5-HT7R agonist (LP-12) on CUMS-induced pigment loss in mice. (A) Experimental procedure diagram about CUMS stress and LP-12 treatment on mice. Mice are pretreated with stress from Day 1 to Day 9, then carried out LP-12 administration for 12 days. (B) 5-HT7R agonist (LP-12) could increase pigment accumulation in mice compared with CUMS group (n = 10). (C) The grayscale ratio of mice was performed at 10 or 12 days by Image J. (D) Skin tissues were serially sectioned and stained with HE assays. The HFs of mice treated with LP-12 had a significant pigmentary response compared with other groups. (E) Skin tissues were lysed and then carried out by western blot. LP-12 group could increase the expressions of 5-HT7R, Mitf, and Tyr in the stressed skin. Representative images from 3 mice are shown.
|
|
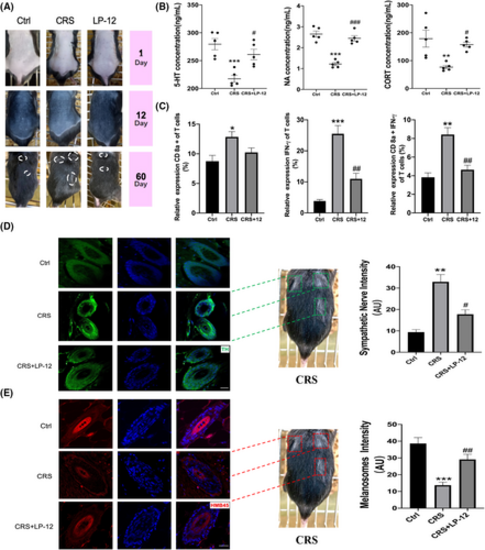
Effects of 5-HT7R agonist (LP-12) on CRS-induced pigment loss in C57BL/6 mice. (A) LP-12 increased pigment accumulation in C57BL/6 mice compared WITH CUMS (n = 5). (B) Serum 5-HT, NE, and CORT levels were measured in various mouse groups **p < .01, ***p < .001, compared with the Ctrl. #p < .05, ###p < .001, compared with the CRS. (C) Expressions of CD8a+, IFN-?, and CD8a+ + IFN-? were severally tested in the CRS-induced mice? spleen cells of different groups (n = 3). *p < .01, **p < .01, ***p < .001, compared with the Ctrl. ##p < .01, compared with the CRS. (D) Left, immunofluorescent staining of sympathetic nerves or ganglia (green) for tyrosine hydroxylase (TH) in the skin tissues (n = 3 mice for each condition). Middle, the mice stimulated with CRS were respectively marked with mostly white hairs (green box). Right, Fluorescence intensity of sympathetic nerve was statistically evaluated by Image J. Bar = 25 ?m. Original magnification was 400×. (E) Left, immunofluorescent staining of melanosomes (red) for HMB45 in the skin tissues (n = 3). Middle, the mice stimulated with CRS were respectively marked with mostly white hairs (red box). Right, Fluorescence intensity of HMB45 was statistically evaluated by Image J. Original magnification was 400×. Bar = 25 ?m. Representative images from three mice were shown.
|
|
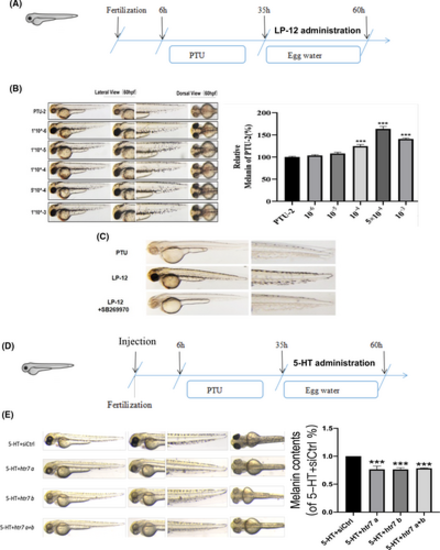
Effects of 5-HT7R agonist (LP-12) and antagonist (SB269970) on melanin synthesis in two zebrafish models. (A) Schematic drawing of the experimental procedure on LP-12-induced pigmentation in zebrafish vivo model. (B) Left, zebrafishes were treated with PTU-2 (PTU removal and water given) at 35 or other five concentrations of LP-12 (0.1, 1, 10, 50, and 100 ?M) and then observed under a stereomicroscope (MI16) in lateral and dorsal views of the embryos at 60 h. Right, the relative melanin content was calculated by Image J (n = 30). ***p < .001, compared with the PTU-2. (C) Observation of LP-12 or LP-12 combining with SB269970 induced melanogenesis in the zebrafish, compared with PTU-2 (PTU always treating). (D) Schematic drawing of the experimental procedure on 5-HT-induced pigmentation in 5-HT7R gene knockdown zebrafish model. (E) Left, zebrafishes were respectively injected Cas9 protein or htr7a-sgRNA or htr7b-sgRNA or htr7a-sgRNA + htr7b-sgRNA protein, then treated with PTU (PTU removal and water given) at 35 h and 5-HT administration, then observed under a stereomicroscope (MI16) in lateral and dorsal views of the embryos at 60 h. Right, the relative melanin content was calculated by Image J. ***p < .001, compared with the 5-HT + Si-Ctrl. Each value represents the mean ± SEM (n = 5).
|
|
Expression profiles of differentially expressed genes in C57BL/6 skin tissues. (A) Heat map, LP-12 skin transcriptome profile. Clustering appropriately captures the experimental design and study group expression differences. (B, C) Volcano plots compare CUMS against Ctrl or LP-12 versus CUMS. Each gene's ?log(P) is displayed against the log2 ratio of changing intensity to normal intensity. Red dots show increased skin tissue genes, green dots downregulated genes, and blue dots no change. (D) LP-12 skin tissue growth and extracellular structural organization vary from CUMS. Dendrite-related gene response heatmap and cluster dendrogram. (F) Bar graphs of LP-12 and CUMS differentially expressed genes in cellular motility, extracellular matrix architecture, and integrin cell surface contact. (G) KEGG analysis showed LP-12 and CUMS activated migration-related pathways. Representative images from 3 mice are shown.
|
|
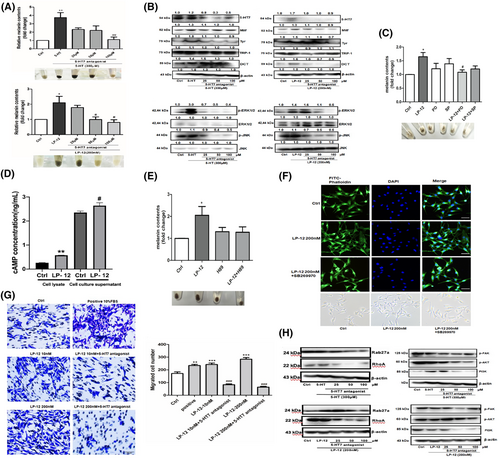
Effects of 5-HT and 5-HT7R selective agonist LP-12 combined with SB269970 on melanin contents, dendrite, or migration in B16F10 cells. (A) Top, the effect of 5-HT combined with SB269970 on melanin contents in B16F10 cells. Bottom, the effect of LP-12 combined with SB269970 on melanin contents in B16F10 cells. Each value represents the mean ± SEM (n = 3). *p < .05, **p < .01, compared with the Ctrl. #p < .05, ##p < .01, compared with the 5-HT or LP-12. (B) After the 5-HT or 5-HT7R agonist LP-12 acts on the B16F10 cells, the expression of 5-HT7R, MITF, Tyr, and DCT was upregulated, and the antagonist SB269970 could block this trend. 5-HT7R agonist LP-12 treated on the B16F10 cells, initiated the downstream P38/ERK1/2/JNK MAPKs signaling pathway through selectively activating 5-HT7R, thereby promoting the melanogenesis process. Representative images are shown from three independent experiments. (C) B16F10 cells were pre-incubated with SP600125 (10 ?M) and PD98059 (10 ?M) for 2 h prior to the addition of LP-12 (200 nM), and then incubated for 72 h for the measurement of melanin content. (D) Concentration levels of cAMP induced by LP-12 in cell lysate and cell culture supernatant. **p < .01, compared with the Ctrl in cell lysate. #p < .05, compared with the Ctrl in cell culture supernatant. (E) B16F10 cells were pre-incubated with H89 (10 ?M) for 2 h prior to the addition of LP-12 (200 nM) and then incubated for 72 h for the measurement of melanin content. (F) 5-HT7R agonist LP-12 had an increase on dendrite length and F-Actin. (G) Left, LP-12 (10 nM, 200 nM)-stimulated cell migration was significantly reduced after incubation with 5-HT7R antagonist SB269970. Right, the number of migrated cell was calculated by Image J. (n = 3) **p < .01, ***p < .001, compared with the Ctrl. ###p < .001, compared with the LP-12. (H) The effects of 5-HT or LP-12 combined with SB269970 on expression levels of downstream Rab27a/RhoA and PI3K/AKT signaling pathway. Representative image from three independent experiments is shown.
|
|
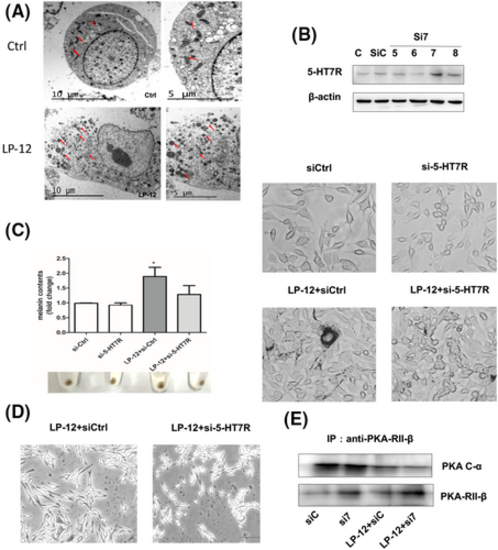
Effects of 5-HT7R selective agonist LP-12 on melanosome maturation or quantities and 5-HT7R Silencing Test and IP on melanogenesis process in B16F10 cells. (A) LP-12 (200 nM) treated with B16F10 cells for 72 h, compared with Ctrl, could cause cellular hyper-pigmentation via promoting melanosomes maturation and quantities observed by transmission electron microscopy (Tecnai G2 Spirit BioTWIN, 2550× or 4200×). Each value represents the mean ± SEM (n = 3). (B) Expression of 5-HT7R gene silencing fragment protein. (C) Left, effect of silencing 5-HT7R gene on melanin contents in B16F10 cells. *p < .05, compared with LP-12 + si-Ctrl group. Right, observation of melanin granules by silencing 5-HT7R gene. Bar = 50 ?m. (D) Observation of dendritic morphology by silencing 5-HT7R gene. Bar = 50 ?m. Original magnification was 400×. (E) Effect of silencing 5-HT7R gene on interaction of PKA-RII-? and PKA C-? protein in vitro. Representative image from three independent experiments is shown.
|
|
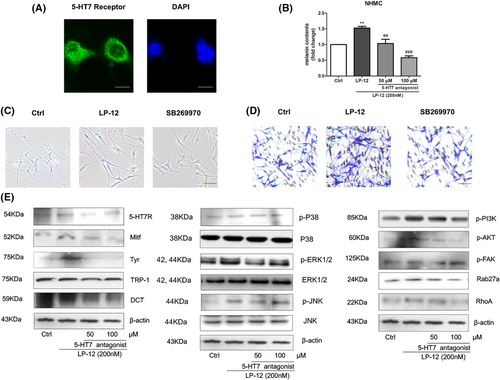
Effects of 5-HT7R agonist (LP-12) only or combined with its antagonist (SB269970) on melanogenesis, dendrite, and migration in normal human melanocytes (NHMCs). (A) 5-HT7R or DAPI respectively were stained with green or blue. (B) The effects of LP-12 and SB269970 on melanin contents in the NHMCs. Each value represents the mean ± SEM (n = 3). **p < .01, compared with the Ctrl, ###p < .001, compared with the LP-12. (C,D) LP-12 (200 nM) and SB269970 (100 ?M) respectively regulated dendrite and migration in the NHMCs. Bar = 25 ?m. (E) Left, the expressions of 5-HT7 receptor, MITF, Tyr, and DCT were upregulated after the 5-HT or LP-12 were treated in the NHMCs, and SB269970 could inhibit it. It also could initiate the downstream ERK1/2 and JNK MAPKs signaling pathway through the 5-HT7R activation, thereby promoting the melanin synthesis process. Right, LP-12 respectively promotes downstream Rab27a and RhoA or PI3K/AKT pathway and FAK phosphorylation to improve the functions of dendrite growth and migration in NHMCs. Representative image from three independent experiments is shown.
|
|
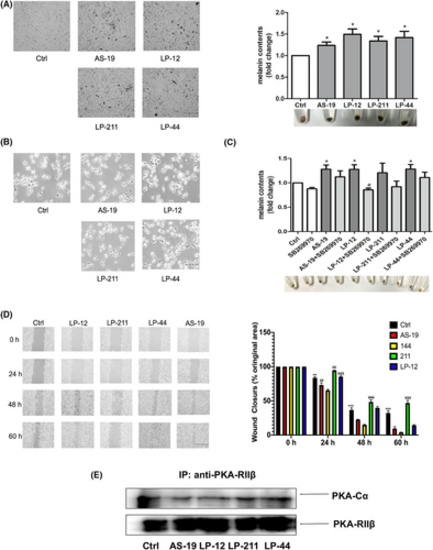
Effects of four different 5-HT7R selective agonists combined with antagonist (SB269970) on melanin synthesis in B16F10 cells. (A) Left, observation of four different 5-HT7R selective agonists on melanin granules in B16F10. Right, the relative melanin content was calculated by Image J (n = 3). *p < .05, compared with the Ctrl. (B) Observation of four different 5-HT7R selective agonists on dendritic morphology in B16F10 cells. *p < .05, compared with the Ctrl. (C) Effect of four different 5-HT7R selective agonists combining with SB269970 on melanin content in B16F10. *p < .05, compared with the Ctrl, #p < .05, compared with the SB269970. (D) Left, wound healing experiment of four different 5-HT7R selective agonists on cell migration at 0, 24, 48, and 60 h in B16F10 cells. Right, the relative wound closure area was calculated by Image J (n = 3). *p < .05, compared with the Ctrl. Each value represents the mean ± SEM (n = 5). (E) Effect of four different 5-HT7R selective agonists on activation of PKA C-? protein in vitro. Representative image from three independent experiments is shown.
|


