
Image
|
Figure Caption
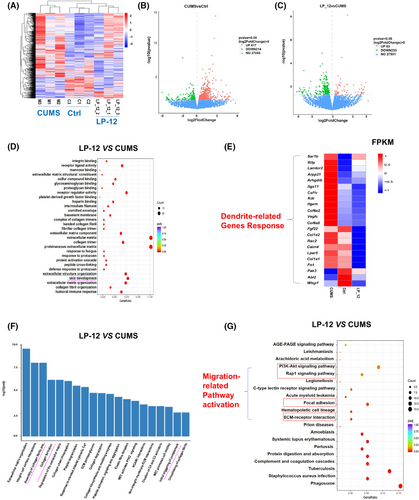
Fig. 4
Expression profiles of differentially expressed genes in C57BL/6 skin tissues. (A) Heat map, LP-12 skin transcriptome profile. Clustering appropriately captures the experimental design and study group expression differences. (B, C) Volcano plots compare CUMS against Ctrl or LP-12 versus CUMS. Each gene's −log(P) is displayed against the log2 ratio of changing intensity to normal intensity. Red dots show increased skin tissue genes, green dots downregulated genes, and blue dots no change. (D) LP-12 skin tissue growth and extracellular structural organization vary from CUMS. Dendrite-related gene response heatmap and cluster dendrogram. (F) Bar graphs of LP-12 and CUMS differentially expressed genes in cellular motility, extracellular matrix architecture, and integrin cell surface contact. (G) KEGG analysis showed LP-12 and CUMS activated migration-related pathways. Representative images from 3 mice are shown.
Acknowledgments
This image is the copyrighted work of the attributed author or publisher, and
ZFIN has permission only to display this image to its users.
Additional permissions should be obtained from the applicable author or publisher of the image.
Full text @ FASEB J.