
- Title
-
Establishment of a non-alcoholic fatty liver disease model by high fat diet in adult zebrafish
- Authors
- Li, X., Zhou, L., Zheng, Y., He, T., Guo, H., Li, J., Zhang, J.
- Source
- Full text @ Animal Model Exp Med
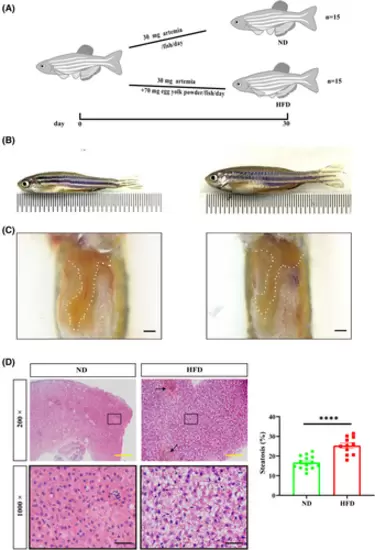
Feeding protocol, zebrafish body size and liver phenotype. (A) Feeding protocol. Adult zebrafish (3 mpf) were randomly divided into two groups. The normal diet (ND) group was fed 30 mg artemia/fish/day, while the high-fat diet (HFD) group was fed 30 mg artemia/fish/day and 70 mg egg yolk/fish/day powder. feeding lasted for 30 days. (B) After completion of feeding, the HFD group (right) showed a significantly obese body shape compared to the ND group (left). (C) After exposing the abdomen, the liver of zebrafish in the HFD group (right) appears distinctly yellow, while the liver of zebrafish in the ND group (left) is orange-red. Scale bar: 1 mm. (D) H&E staining results demonstrating steatosis and inflammatory cell infiltration. In the ND group 10–20% steatosis was observed, while in the HFD group 20–30% steatosis with marked inflammatory cell infiltration was observed. The black arrow indicates the regions where large numbers of nuclei are aggregated and the ballooning degeneration is seen as blank regions in the cytoplasm with the nucleus hanging in the center or squeezed to the side. The solid black box indicates the magnified area, and the high magnification image is shown below. Scale bars: yellow, 100 μm; black, 20 μm. 5 fields of view per fish (ND: n = 14; HFD: n = 11). The rate of steatosis was counted by Image J. Bar graphs, mean ± SEM. ****p < 0.0001. PHENOTYPE:
|
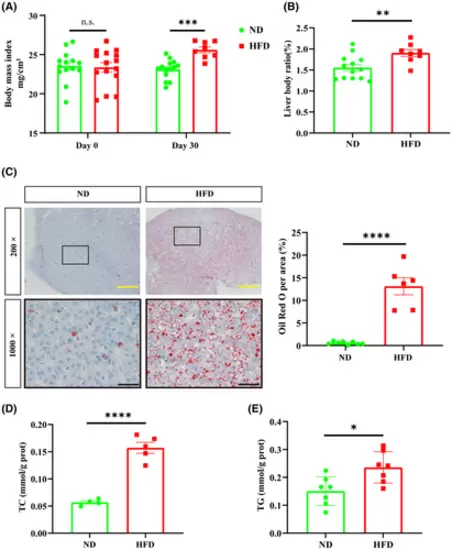
High-fat diet causes lipid accumulation in zebrafish. (A) BMI at the beginning and at the end of feeding. No significant difference in BMI between ND and HFD groups at the beginning of feeding experiment was recorded (ND: n = 14; HFD: n = 15), but at the end of feeding, BMI was significantly higher in the HFD group compared to the ND group (ND: n = 14; HFD: n = 8). (B) Liver-to-body ratio (LBR) was significantly higher in the HFD group (ND: n = 13; HFD: n = 8). (C) ORO staining showed large lipid accumulation in the livers of the HFD group. The solid black box indicates the magnified area, and the high magnification image is shown below. Scale bars: yellow 100 μm, black 20 μm. 5 fields of view per fish (ND: n = 8; HFD: n = 6). The ratio of red lipid droplets was counted by Image J. (D) Zebrafish liver TC content (two livers were combined into one sample, ND: n = 4; HFD: n = 5). (E) Zebrafish liver TG content (two livers pooled into one sample, ND: n = 5; HFD: n = 5). Bar graphs show mean ± SEM. n.s., not statistically significant, *p < 0.05, **p < 0.01, ***p < 0.001, ****p < 0.0001. PHENOTYPE:
|
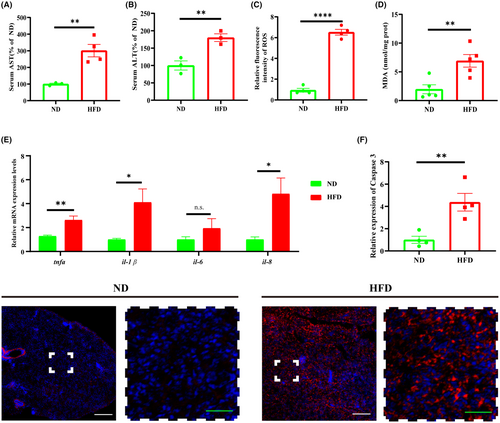
High-fat diet causes pathological changes in the liver of zebrafish. (A) Zebrafish serum AST levels (serum from 5 fish in one sample, ND: n = 3; HFD: n = 4 repeats). (B) Zebrafish serum ALT levels (serum from 5 fish in one sample, ND: n = 3; HFD: n = 3 repeats). (C) Zebrafish liver ROS levels (two livers pooled into one sample, ND: n = 4; HFD: n = 4 repeats). (D) Zebrafish liver MDA levels (two livers pooled one sample, ND: n = 5; HFD: n = 5 repeats) (E) Liver RNA was extracted for qRT-PCR assay to detect the expression levels of mRNAs of inflammatory factors. (F) Hepatocyte apoptosis was observed by staining with Caspase-3 protein. The expression level of Caspase-3 was significantly increased in the HFD group compared with the ND group, and hepatocytes were extensively apoptotic. The solid white box indicates the magnified area, and the high magnification image is shown below. Scale bars: white 100 μm, green 30 μm. 3 fields of view per fish (ND: n = 4; HFD: n = 4 repeats). Mean grayscale values were counted by Image J. Bar graphs show mean ± SEM. n.s. means not statistically significant, *p < 0.05, **p < 0.01, ****p < 0.0001. |
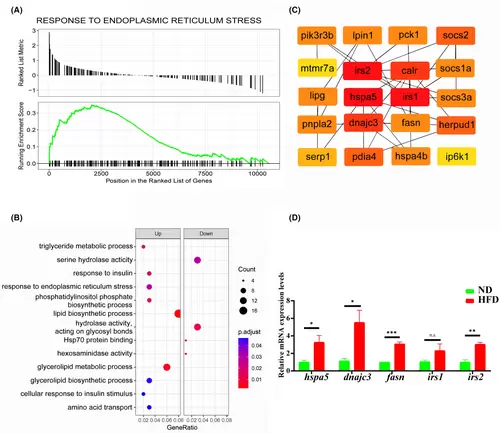
RNA-seq analysis of changes in gene transcript levels during NALFD progression. (A) GSEA analysis of differentially expressed genes with significant upregulation of response pathways to endoplasmic reticulum stress. (B) Bubble plot of GO analysis restlt, lipid synthesis, insulin response and endoplasmic reticulum stress pathways were significantly upregulated. (C) Screening results of cytoHubba app module with the top 20 highest scoring genes. (D) qRT-PCR validation of mRNA expression levels of endoplasmic reticulum stress molecules, fatty acid synthase and insulin substrate receptor (more than three samples were tested for each gene). n.s., no statistical significance, *p < 0.05, **p < 0.01, ***p < 0.001. |