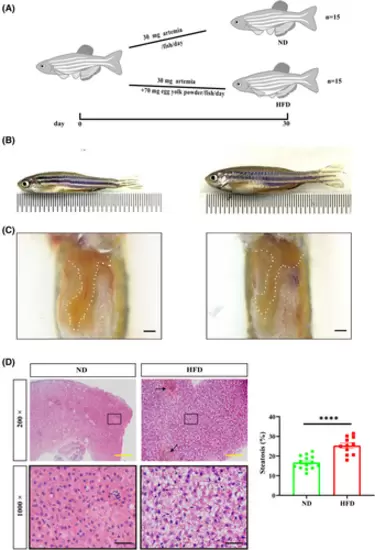
Feeding protocol, zebrafish body size and liver phenotype. (A) Feeding protocol. Adult zebrafish (3 mpf) were randomly divided into two groups. The normal diet (ND) group was fed 30 mg artemia/fish/day, while the high-fat diet (HFD) group was fed 30 mg artemia/fish/day and 70 mg egg yolk/fish/day powder. feeding lasted for 30 days. (B) After completion of feeding, the HFD group (right) showed a significantly obese body shape compared to the ND group (left). (C) After exposing the abdomen, the liver of zebrafish in the HFD group (right) appears distinctly yellow, while the liver of zebrafish in the ND group (left) is orange-red. Scale bar: 1 mm. (D) H&E staining results demonstrating steatosis and inflammatory cell infiltration. In the ND group 10–20% steatosis was observed, while in the HFD group 20–30% steatosis with marked inflammatory cell infiltration was observed. The black arrow indicates the regions where large numbers of nuclei are aggregated and the ballooning degeneration is seen as blank regions in the cytoplasm with the nucleus hanging in the center or squeezed to the side. The solid black box indicates the magnified area, and the high magnification image is shown below. Scale bars: yellow, 100 μm; black, 20 μm. 5 fields of view per fish (ND: n = 14; HFD: n = 11). The rate of steatosis was counted by Image J. Bar graphs, mean ± SEM. ****p < 0.0001.
|
