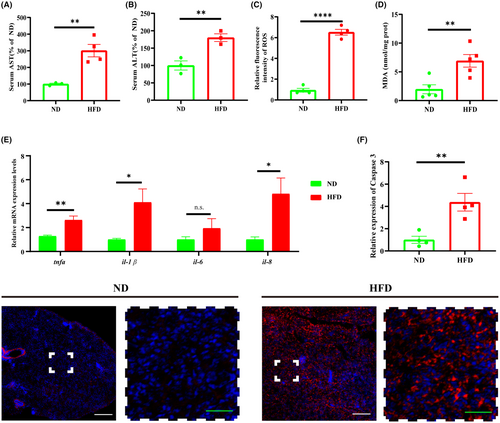
High-fat diet causes pathological changes in the liver of zebrafish. (A) Zebrafish serum AST levels (serum from 5 fish in one sample, ND: n = 3; HFD: n = 4 repeats). (B) Zebrafish serum ALT levels (serum from 5 fish in one sample, ND: n = 3; HFD: n = 3 repeats). (C) Zebrafish liver ROS levels (two livers pooled into one sample, ND: n = 4; HFD: n = 4 repeats). (D) Zebrafish liver MDA levels (two livers pooled one sample, ND: n = 5; HFD: n = 5 repeats) (E) Liver RNA was extracted for qRT-PCR assay to detect the expression levels of mRNAs of inflammatory factors. (F) Hepatocyte apoptosis was observed by staining with Caspase-3 protein. The expression level of Caspase-3 was significantly increased in the HFD group compared with the ND group, and hepatocytes were extensively apoptotic. The solid white box indicates the magnified area, and the high magnification image is shown below. Scale bars: white 100 μm, green 30 μm. 3 fields of view per fish (ND: n = 4; HFD: n = 4 repeats). Mean grayscale values were counted by Image J. Bar graphs show mean ± SEM. n.s. means not statistically significant, *p < 0.05, **p < 0.01, ****p < 0.0001.
|
