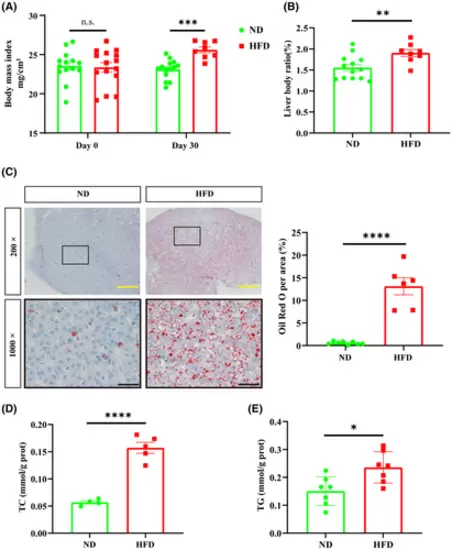
High-fat diet causes lipid accumulation in zebrafish. (A) BMI at the beginning and at the end of feeding. No significant difference in BMI between ND and HFD groups at the beginning of feeding experiment was recorded (ND: n = 14; HFD: n = 15), but at the end of feeding, BMI was significantly higher in the HFD group compared to the ND group (ND: n = 14; HFD: n = 8). (B) Liver-to-body ratio (LBR) was significantly higher in the HFD group (ND: n = 13; HFD: n = 8). (C) ORO staining showed large lipid accumulation in the livers of the HFD group. The solid black box indicates the magnified area, and the high magnification image is shown below. Scale bars: yellow 100 μm, black 20 μm. 5 fields of view per fish (ND: n = 8; HFD: n = 6). The ratio of red lipid droplets was counted by Image J. (D) Zebrafish liver TC content (two livers were combined into one sample, ND: n = 4; HFD: n = 5). (E) Zebrafish liver TG content (two livers pooled into one sample, ND: n = 5; HFD: n = 5). Bar graphs show mean ± SEM. n.s., not statistically significant, *p < 0.05, **p < 0.01, ***p < 0.001, ****p < 0.0001.
|
