|
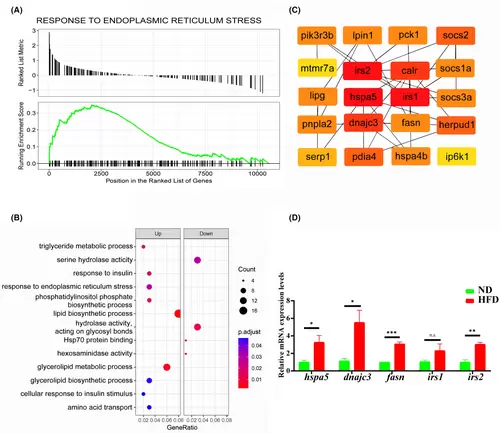
RNA-seq analysis of changes in gene transcript levels during NALFD progression. (A) GSEA analysis of differentially expressed genes with significant upregulation of response pathways to endoplasmic reticulum stress. (B) Bubble plot of GO analysis restlt, lipid synthesis, insulin response and endoplasmic reticulum stress pathways were significantly upregulated. (C) Screening results of cytoHubba app module with the top 20 highest scoring genes. (D) qRT-PCR validation of mRNA expression levels of endoplasmic reticulum stress molecules, fatty acid synthase and insulin substrate receptor (more than three samples were tested for each gene). n.s., no statistical significance, *p < 0.05, **p < 0.01, ***p < 0.001.
|