
- Title
-
Endothelial cells require functional FLVCR1a during developmental and adult angiogenesis
- Authors
- Petrillo, S., De Giorgio, F., Bertino, F., Garello, F., Bitonto, V., Longo, D.L., Mercurio, S., Ammirata, G., Allocco, A.L., Fiorito, V., Chiabrando, D., Altruda, F., Terreno, E., Provero, P., Munaron, L., Genova, T., Nóvoa, A., Carlos, A.R., Cardoso, S., Mallo, M., Soares, M.P., Tolosano, E.
- Source
- Full text @ Angiogenesis
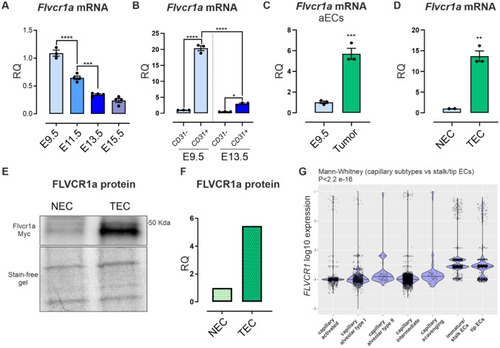
FLVCR1a expression is enhanced in angiogenic endothelial cells (aECs). |
|
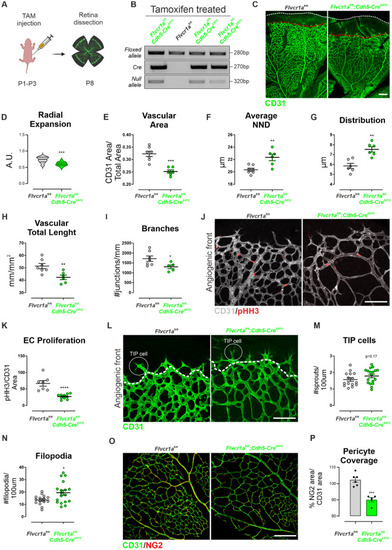
Retinal angiogenesis is compromised in endothelial |
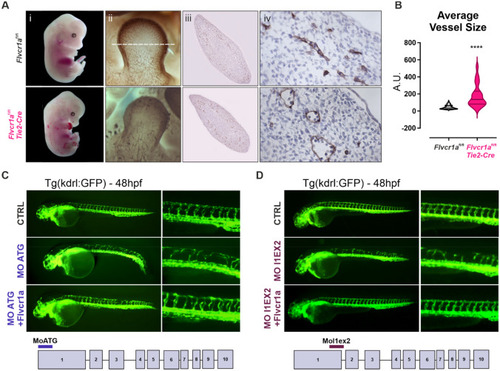
Endothelial |
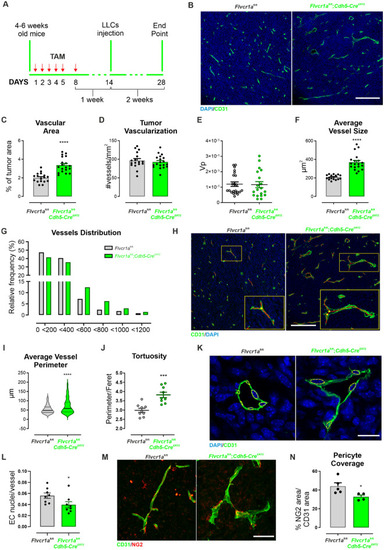
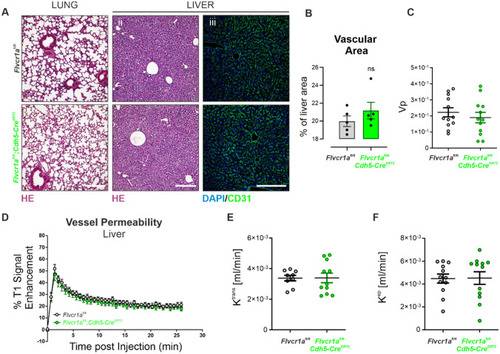
Endothelial |
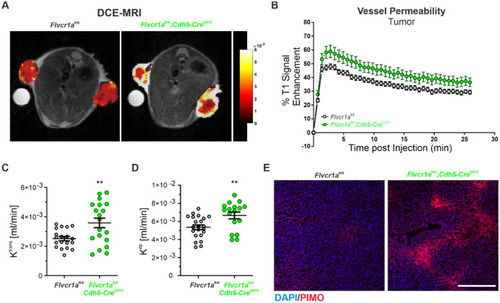
Endothelial |
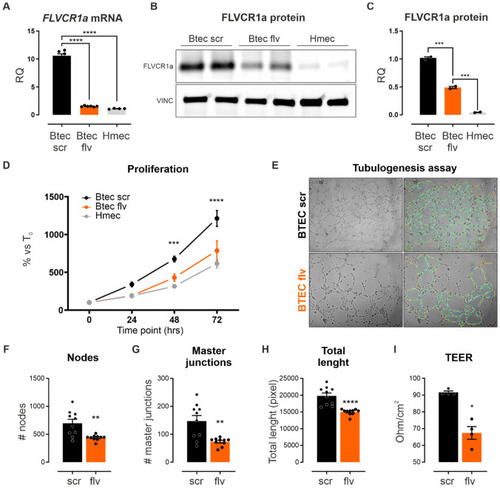
FLVCR1a modulates the angiogenic potential of human tumor-derived ECs in vitro. |
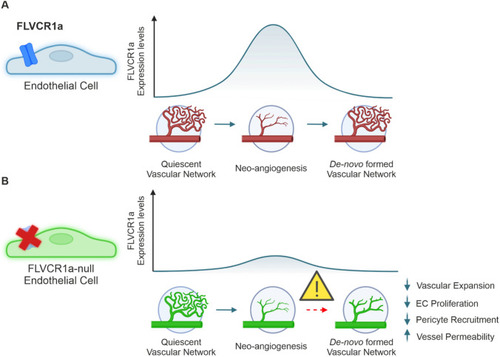
Endothelial FLVCR1a is required for proper angiogenesis. |