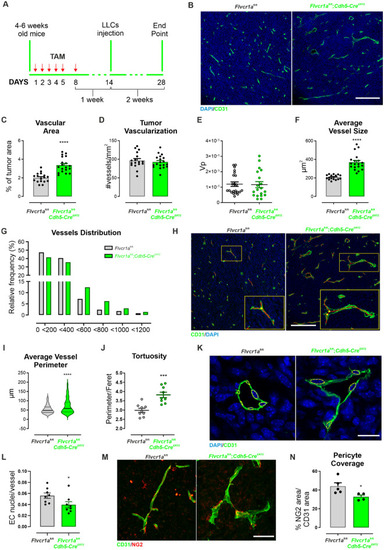
Endothelial Flvcr1a deficiency impairs tumor angiogenesis. A Schematic representation of tamoxifen (TAM) treatment in Flvcr1afl/fl;Cdh5-CreERT2 and Flvcr1afl/fl control mice. B Confocal images of CD31 (green) and DAPI (blu)-stained tumor sections from Flvcr1afl/fl and Flvcr1afl/fl;Cdh5-CreERT2 to highlight the tumor vasculature. C Tumor vascular area quantification as % CD31 of tumor area. Scale bar: 200 µm. D Tumor vascularization expressed as number of vessels/mm2. E Gadolinium-based DCE-MRI analysis to measure tumor vascular volume (Vp) in Flvcr1afl/fl and Flvcr1afl/fl;Cdh5-CreERT2 animals. E–G Quantification of (E) average vessel size, F vessel area distribution and G average vessel perimeter in Flvcr1afl/fl and Flvcr1afl/fl;Cdh5-CreERT2 tumors. H Representative images showing the ImageJ “skeletonize tool” used to infer network descriptive parameters (e.g., vessel perimeter, Feret’s diameter) on tumor sections. I–J Histograms showing quantification of I average vessel perimeter and J vessel tortuosity (expressed as perimeter/Feret’s diameter) in Flvcr1afl/fl and Flvcr1afl/fl;Cdh5-CreERT2 tumor sections. K High magnification of CD31 (green) and DAPI (blu)-stained Flvcr1afl/fl and Flvcr1afl/fl;Cdh5-CreERT2 tumor vessels. ECs nuclei are comprised in yellow dashed lines. Scale bar: 20 µm. L Quantification of average number EC nuclei per vessel perimeter in Flvcr1afl/fl and Flvcr1afl/fl;Cdh5-CreERT2 tumors. M Confocal images of CD31 (green) and NG2 (red) stained thick tumor Sects. (20 µm) from Flvcr1afl/fl and Flvcr1afl/fl;Cdh5-CreERT2 mice. Scale bar: 50 µm. N Quantification of pericyte coverage as % NG2 area/CD31 area. LLCs Lewis Lung Carcinoma cells, TAM tamoxifen. Data are representative of at least 3 independent experiments and are expressed as mean ± SEM. *p < 0.05; ***p < 0.001; ****p < 0.0001. For statistical analyses, an unpaired Student’s t test was used
|
