IMAGE

Fig. 3

ID
ZDB-IMAGE-230710-37
Source
Figures for Petrillo et al., 2023
Image
Figure Caption

Fig. 3

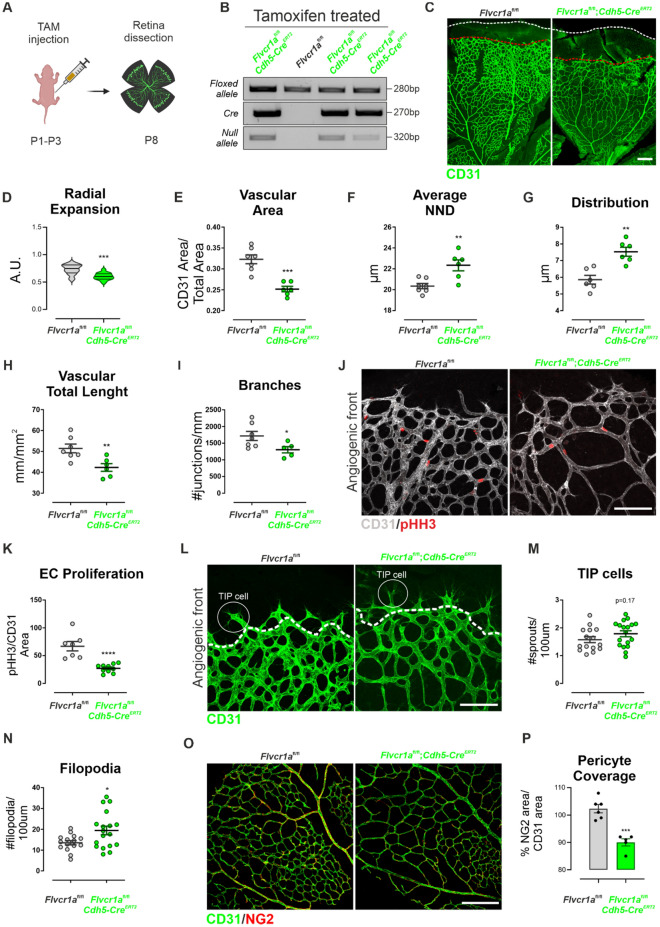
Retinal angiogenesis is compromised in endothelial Flvcr1a-null mice. A Schematic representation of tamoxifen (TAM) treatment and retina dissection in Flvcr1a;Cdh5-CreERT2 and Flvcr1a control mice. Briefly, pups were injected with TAM into the stomach for 3 consecutive days (P1–P3) to induce Flvcr1a gene deletion in the developing retinal vasculature. Retinas were isolated at P8 to analyze angiogenesis. B Representative PCR products from DNA analysis on Flvcr1afl/fl and Flvcr1afl/fl;Cdh5-CreERT2 pups after tamoxifen treatment. Deletion of the first exon of Flvcr1a gene mediated by Cre recombinase gave rise to a band referred to as ‘‘null allele.’’ Specific primers were used to amplify Cre recombinase (270 bp), Flvcr1a floxed (280 bp), and Flvcr1a null (320 bp) alleles. C Whole-mount CD31 staining (green) of P8 retinal primary vascular plexus from Flvcr1afl/fl and Flvcr1afl/fl;Cdh5-CreERT2 mice. Scale bar: 200 µm. DI Quantification of vascular parameters of Flvcr1afl/fl and Flvcr1afl/fl;Cdh5-CreERT2 P8 retinas, i.e., D radial expansion, E vascular area, F average nearest neighbor distance (NND), G vessel distribution variability, H vascular total length, I number of branches. J CD31 (gray)/pHH3 (red) double staining of Flvcr1afl/fl and Flvcr1afl/fl;Cdh5-CreERT2 P8 retinas, and K quantification of pHH3+ ECs. Scale bar: 100 µm. L Higher magnification of the angiogenic front in Flvcr1afl/fl and Flvcr1afl/fl;Cdh5-CreERT2 P8 retinas stained with CD31 antibody to highlight the vasculature. Tip cells are white circled. Scale bar: 100 µm. M Tip cells and N filopodia quantification is shown. O Whole-mount staining of Flvcr1afl/fl and Flvcr1afl/fl;Cdh5-CreERT2 P8 retinas with CD31 (green) and NG2 (red) antibodies to highlight ECs and pericyte, respectively. Scale bar: 200 µm. P Quantification of pericyte coverage as % ratio of NG2 area and CD31 area. Data are representative of at least 3 independent experiments and are expressed as mean ± SEM. *p < 0.05; **p < 0.01; ***p < 0.001; ****p < 0.0001; For statistical analyses ,an unpaired Student’s t test was used. TAM tamoxifen, P post-natal day, bp base pairs, A.U. arbitrary unit

Acknowledgments
This image is the copyrighted work of the attributed author or publisher, and ZFIN has permission only to display this image to its users. Additional permissions should be obtained from the applicable author or publisher of the image. Full text @ Angiogenesis