
- Title
-
Single-cell transcriptomic profiling of the zebrafish inner ear reveals molecularly distinct hair cell and supporting cell subtypes
- Authors
- Shi, T., Beaulieu, M.O., Saunders, L.M., Fabian, P., Trapnell, C., Segil, N., Crump, J.G., Raible, D.W.
- Source
- Full text @ Elife

(A) Illustration of the lateral line system of a 5 dpf zebrafish. Blue circles represent individual neuromasts located on the body of the fish. Boxed region indicates location of the ear. (B) Enlarged diagram of the 5 dpf zebrafish ear showing cristae (red) and macular (blue) sensory organs. (C,D) Illustrations of adult zebrafish and mouse inner ears showing homologous end organs in the semicircular canal crista ampullaris (red) and macula otolith organs (blue). Light green and dark green represent unique end organs of the lagena in zebrafish and cochlea in mice. (E) Illustration of the mouse utricle showing striolar and extrastriolar regions of the sensory organ. Arrows represent hair cell planar polarity within the sensory organ and red dashed line represents the line of polarity reversal within the striola. ac: anterior crista, c: cochlea, l: lagena, lc: lateral crista, o: otolith, pc: posterior crista, s: saccule, u: utricle.
|

Ear and lateral line cells were selected from a whole-embryo single-nucleus RNA-seq dataset from animals between 18 and 96 hpf using known marker genes for hair cells and supporting cells. (A–B) UMAP projection of inner ear and lateral line cells grouped by (A) developmental timepoint and (B) broad cell type: ear nonsensory SC (red), lateral line nonsensory SC (green), ear HC (blue), and lateral line HC (yellow). Clusters in (B) correspond to columns of following gene expression plots. Widely accepted marker genes for (C) inner ear nonsensory cells, (D) lateral line nonsensory cells, and (E) hair cells show enriched expression in the corresponding clusters from B, confirming their identity. (F) Expression of previously identified marker genes for inner ear or lateral line hair cells was used to identify hair cell origin.
|

(A–D) Integration and analysis of single-cell RNAseq data generated by sci-Seq (sci) or 10x Chromium sequencing (10x) for inner ear hair cells and supporting cells from embryonic (sci), larval (sci,10x), and adult (10x) stages. UMAP projection of cells are grouped by (A) dataset of origin and (B) timepoint. (C) Unsupervised clustering divides cells into 10 clusters that were grouped into 9 cell subtypes. (D) Feature plots showing hair cell marker myo6b, nascent hair cell marker dla, supporting cell marker lfng, and putative progenitor marker fgfr2 expression in the integrated dataset. (E) Differentially expressed genes across the 10 cell clusters.
|

(A,B) Pseudotime analysis of macular cells showing simulated developmental trajectories of a putative bipotent progenitor population into hair cell and supporting cell clusters. (C,D) Changes in putative progenitor markers along (C) hair cell and (D) supporting cell trajectories. fat1a and pard3bb only decrease along the hair cell trajectory, while fgfr2 and igsf3 decrease along both hair cell and supporting cell trajectories. (E) Transient expression of early hair cell genes dla and atoh1a along hair cell trajectories. (F) Increases in gene expression levels of gfi1aa and myo6b along hair cell trajectories. (G) Increases in stm and lfng along supporting cell trajectories.
|
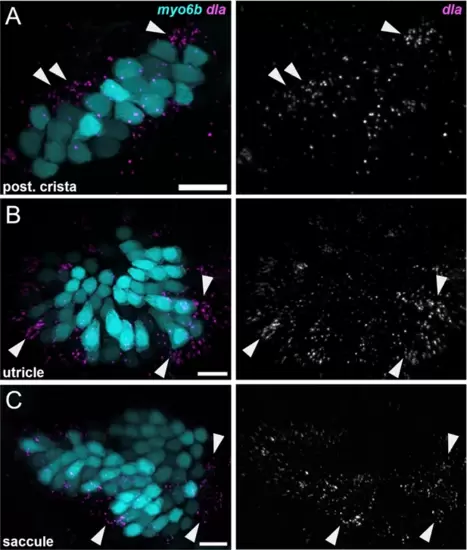
dla labels putative hair cell progenitors in the cristae and maculae. HCR in situ hybridization of 5 dpf zebrafish. Maximum intensity projections of (A) posterior crista (lateral view), (B) utricle (dorsal view), and (C) saccule (lateral view) showing dla expression in a subset of support cells (arrowheads) peripheral to myo6b+hair cells. Scale bars = 10 μm. EXPRESSION / LABELING:
|

(A) Feature plots showing expression of macula supporting cell marker tectb and crista supporting cell marker zpld1a. (B–D) HCR in situ hybridization in myo6b:GFP transgenic animals. Each set of images shown represents a projection of one z-stack split into cristae (lateral) and macula (medial) slices. Lateral line neuromasts positioned over the ear are visible in lateral slices. Expression pattern for (B) the pan-supporting cell marker lfng, (C) macula-specific marker tectb, and (D) crista-specific marker zpld1a in 5 dpf myo6b:GFP fish. Each set of images shown represents a projection of one z-stack split into cristae (lateral) and macula (medial) slices. ac: anterior crista, lc: lateral crista, nm: neuromast, pc: posterior crista, u: utricle, s: saccule. Scale bars = 20 μm.
|
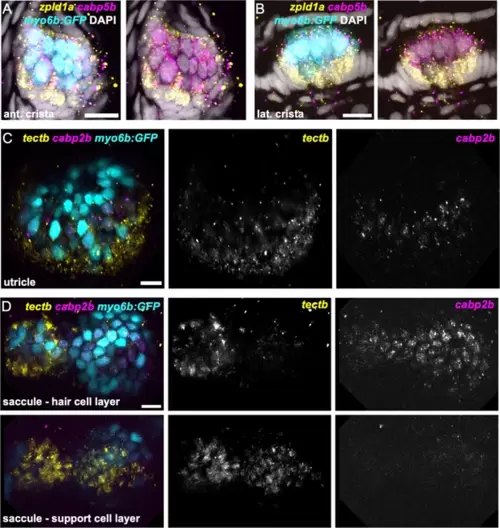
zpld1a and tectb are primarily expressed in supporting cells. HCR in situ hybridization of 5 dpf myo6b:GFP zebrafish. (A–B) Confocal slices through (A) anterior crista and (B) lateral crista (lateral view) show localization of cabp5b in hair cells and zpld1a in supporting cells. (C) Slice through utricle (dorsal view) shows cabp2b expression in hair cells and tectb expression primarily in the surrounding supporting cells. (D) Slices through saccule (lateral view) at the level of hair cell bodies (top row) and supporting cell bodies (bottom row). cabp2b is primarily expressed in hair cells and tectb is primarily expressed in supporting cells. Scale bars = 10 μm. EXPRESSION / LABELING:
|

(A) Feature plots showing differential expression of cabp1b and cabp2b among crista and macula hair cells. (B–D) HCR in situ projections of individual sensory patches from 5 dpf myo6b:GFP fish showing differential spatial expression patterns of cabp1b and cabp2b. (B) cabp1b is expressed at the ends of the cristae, while cabp2b is expressed centrally. Anterior crista is shown. (C) In the utricle, cabp1b is expressed medially and cabp2b is expressed laterally. (D) In the saccule, cabp1b is expressed in peripheral cells at the dorsal and ventral edges of the organ. cabp2b is expressed centrally. Scale bars for HCR images = 10 μm. (E) Cartoon illustrations of the zebrafish utricle, saccule, and lagena, and the expression patterns of cabp1b (yellow) and cabp2b (magenta) within each sensory patch. (F–H) Wholemount RNAScope confocal images of adult inner ear organs showing peripheral expression pattern of cabp1b (n=3) in the adult zebrafish (F) utricle, (G) saccule, and (H) lagena. (I–K) Whole-mount RNAScope confocal images showing central expression pattern of cabp2b (n=4) in the adult zebrafish (I) utricle, (J) saccule, and (K) lagena. Scale bars for RNAScope images = 25 μm.
|
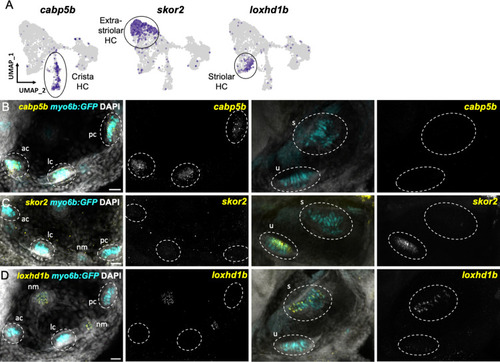
(A) Feature plots showing marker genes enriched in organ-specific subsets of inner ear hair cells: cabp5b, skor2, and loxhd1b. (B–D) HCR in situs in 5 dpf myo6b:GFP fish show expression of (B) cabp5b in crista but not macula hair cells, (C) skor2 in the utricle only, and (D) loxhd1b in the saccule, as well as lateral line neuromast hair cells. Each set of images represents an orthogonal projection of one z-stack split into cristae (lateral) and macular (medial) slices. ac: anterior crista, lc: lateral crista, nm: neuromast, pc: posterior crista, s: saccule, u: utricle. Scale bar = 20 μm.
|

skor2 and loxhd1b label subsets of hair cells in utricle or saccule. HCR in situ hybridization of 5 dpf zebrafish. (A) Maximum intensity projection of utricle (dorsal view) showing skor2 expression in medially located myo6b:GFP+ hair cells. (B) Maximum intensity projection of saccule (lateral view) showing loxhd1b expression in a peripheral subset of hair cells. Scale bars = 10 μm. EXPRESSION / LABELING:
|

(A) Feature plot shows enrichment for the striola marker pvalb9 in cabp2b-expressing striolar cells. (B–D) HCR in situs in 5 dpf myo6b:GFP fish shows pvalb9 and cabp2b co-expression in the utricle. Scale bar = 10 μm. (E) Cartoon illustration of overlapping expression of pvalb9 (white) and cabp2b (magenta) that coincides with the line of hair cell polarity reversal. (F, G) Whole-mount RNAScope confocal images of adult zebrafish utricles showing expression of pvalb9 relative to (F) cabp1b (n=3) and (G) cabp2b (n=4). Scale bar = 25 μm. (H,I) Whole-mount RNAScope RNA and protein co-detection assay showing co-localization of cabp2b expression (RNA) and the hair cell line of polarity reversal indicated by Spectrin (protein) staining (n=3). Scale bar = 25 μm. Arrows denote hair cell polarity and dotted line outlines line of polarity reversal.
|

Striola marker pvalb9 is expressed in all inner ear sensory end organs. HCR in situ hybridization of 5 dpf zebrafish. (A) Maximum intensity projection of saccule (lateral view) shows pvalb9 expression in centrally located myo6b:GFP+ hair cells. (B) Slice through the anterior crista shows pvalb9 expression in a subset of crista hair cells. Scale bars = 10 μm. EXPRESSION / LABELING:
|

(A–B) Sankey plot showing the SAMap mapping scores (0–1) that indicate transcriptome relatedness between (A) mouse utricular and zebrafish macular single-cell clusters and (B) mouse and zebrafish cristae single-cell clusters. A mapping score of 0 indicates no evolutionary correlation in transcriptome while a mapping score of 1 indicates perfect correlation. Correlations below 0.15 were not plotted.
|