
- Title
-
GTP-Binding Protein 1-Like (GTPBP1l) Regulates Vascular Patterning during Zebrafish Development
- Authors
- Lo, Y.H., Huang, Y.S., Chang, Y.C., Hung, P.Y., Wang, W.D., Liu, W., Urade, R., Wen, Z.H., Wu, C.Y.
- Source
- Full text @ Biomedicines
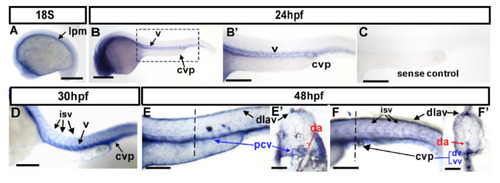
Expression pattern of gtpbp1l mRNA during zebrafish vessel development. (A–F) Spatiotemporal expression of gtpbp1l in the vessels (v), caudal vein plexus (CVP), intersegmental vessels (isv), and dorsal longitudinal anastomotic vessel (dlav) during development as shown at 18S, 24 hpf, 30 hpf, and 48 hpf. A cross-section taken at 48 hpf (E’,F’) clearly shows the expression of gtpbp1l in the dorsal aorta (da), posterior vein (pcv), and CVP. (A) At the 18 somite (18S) stage, gtpbp1l expression is in the lateral plate mesoderm (lpm). (B,B’) At 24 hpf, gtpbp1l is expressed in the vessels (v) and caudal vein plexus (CVP). (B’) is an enlargement of (B). (C) The gtpbp1l sense probe served as a negative control. (D) At 30 hpf, gtpbp1l expression can be observed in the vessels, isv, and CVP (E,E’,F,F’) At 48 hpf, gtpbp1l is expressed continuously in the vessels, isv, dlav, and CVP at the region of the trunk (E) and tail (F). (E’,F’) Cross-sections of embryos from (E,F) show that gtpbp1l is expressed in the dorsal aorta (da), posterior cardinal vein (pcv), dorsal vein (dv), and ventral vein (vv) of the CVP. Scale bars are 200 µm. EXPRESSION / LABELING:
|
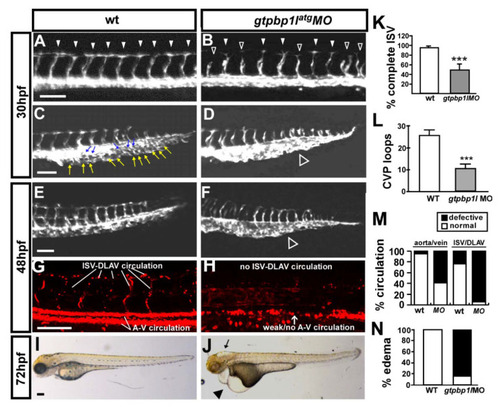
Knockdown of gtpbp1l causes vascular defects in zebrafish development. (A–D) Images of control and gtpbp1latg morpholino (3.4 ng)-injected Tg (flk:eGFP) embryos at 30 hpf. In the uninjected control, ISV reached the DLAV at the dorsal aspect of the embryo (arrowheads in (A)), and the CVP formed loop structures at the tail ((C), white and blue arrows). At the same stage, many ISVs showed slow growth at the mid-somite in gtpbp1latg morphants (hollow arrowheads in (B)) and less endothelial cell sprouting and nearly no loop formation at the CVP (white hollow arrowhead in (D)). (E–H) The injection of gtpbp1l morpholino into transgenic Tg (fli1a:eGFPy1; gata1:dsRedsd2) embryos showed that knockdown of gtpbp1l resulted in circulation defects at 48 hpf. At this stage, there was less CVP loop formation (hollow arrowhead in (F)) in MO embryos compared with controls (E). (I,J) At 72 hpf, gtpbp1latg morphants had pericardial edema (arrowhead in (J)). (K) The percentage of completed ISVs decreased by approximately 40% in gtpbp1latg morphants (n = 35 in wt and n = 32 in gtpbp1latg MO) at 30 hpf. (L) Quantification of CVP formation. (M) Quantification data showing that approximately 95% and 60% of gtpbp1l morphants at 48 hpf had poor blood flow in ISV–DLAV and in aorta–vein, respectively (n = 25 in control and n = 23 in gtpbp1latg MO). (N) Quantification of the percentage of pericardial edema was 85% in gtpbp1latg morphants (n = 26) compared to wt controls (n = 30) at 72 hpf. Data are mean ± S.D. *** indicates p < 0.0001 by unpaired Student’s t-test. Scale bar = 100 µm for (A–H) and 200 µm for (I,J). PHENOTYPE:
|

Overexpression of gtpbp1l rescues the loss of gtpbp1l. (A) In wt control embryos, ISV grows toward the dorsal and formed DLAV at approximately 28–30 hpf (arrowheads). However, ISVs showed slowed or stalled growth at mid-somite in gtpbp1le4i4 MO ((B), hollow arrowheads). (C) Overexpression of gtpbp1l by low-dosage gtpbp1l mRNA injection (0.012 ng) showed no defects in vasculature; however, overexpressed gtpbp1l can rescue the growth defect of ISV ((D), solid arrowheads). (E–H) At 52 hpf, fewer endothelial cells sprouted, and loop formation occurred at the CVP in gtpbp1l MO (white arrows in (F)) compared to the wt control (E). Injection of gtpbp1l mRNA induced no obvious defect in CVP (G) but rescued the defect of CVP loops (H). (I) Quantification of the percentage of embryos with completed ISV at 28 hpf shows an increase of ~32% in rescued embryos compared to gtpbp1l morphants. The percentages of embryos with completed ISV were ~93 ± 7 (n = 23), 28 ± 8 (n = 22), 90 ± 12 (n = 23), and 60 ± 16 (n = 22) in the control, gtpbp1l MO knockdown, gtpbp1l mRNA overexpression, and rescued embryos, respectively. (J) Quantification data of CVP formation were ~27 ± 3 (n = 19), 12 ± 3 (n = 19), 26 ± 4 (n = 17), and 17 ± 3 (n = 19) in the control, gtpbp1l MO knockdown, gtpbp1l mRNA overexpression, and rescued embryos, respectively. *** indicates p < 0.0001 by unpaired Student’s t-test. Data are mean ± S.D. Scale bar = 100 μm for (A–H). |

gtpbp1l is required for the proliferation and migration of ISV cells. (A–D) The TUNEL assay and Acridine orange (AO) staining were used to examine apoptotic cells in wild-type (wt) control and gtpbp1l knockdown morphants. (A,B) The number of apoptotic cells (black dots) likely increased in the epidermis of the dorsal region instead of vessel areas in gtpbp1l MO compared to controls at 30 hpf. (C,D) AO staining in Tg (kdrl:mCherry)ci5 fish showed that more apoptotic cells (green dots) were present in the dorsal region of the embryos, but not in vasculature (red fluorescence) after gtpbp1l knockdown. (E,F) At 30 hpf, using transgenic fish Tg(kdrl:mCherryci5; fli1a:negfp y7), the number of ISV endothelial cells can be counted in wt control and gtpbp1l morphants. (G) Quantification of the average numbers of ISV endothelial cells per ISV in wt control (4.1 ± 0.8, n = 30 ISVs from 6 embryos) and gtpbp1l morphants (2.5 ± 1.3, n = 30 ISVs from 6 embryos). Scale bars are 200 μm for (A–D) and 100 μm for (E,F). Data are represented as means ± S.D. *** refers to p < 0.0001 by an unpaired Student’s t-test. PHENOTYPE:
|
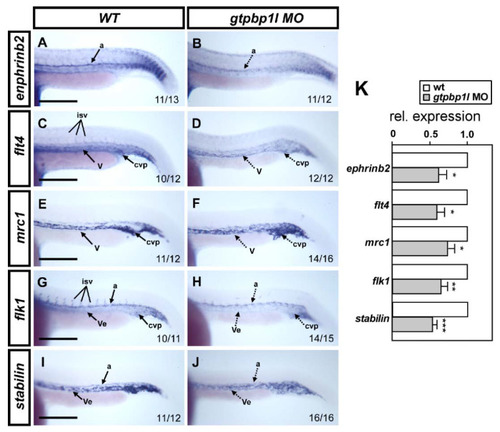
Loss of gtpbp1l reduced the expression of vessel-related markers. (A,C,E,G,I) Whole-mount in situ hybridization in wild-type (wt) controls and in gtpbp1latg morphants (B,D,F,H,J). At 24 hpf, gtpbp1latg morphants showed decreased expression (dash lines) of the arterial marker ephrinb2 (B), venous markers flt4 (D) and mrc1 (F), and pan-vascular markers flk (H) and stabilin (J) compared to controls. Dorsal aorta (a); vein (v); vessel (Ve); intersegmental vessels (isv), and caudal vein plexus (CVP). (K) Quantitative qPCR analysis revealed the relative expression levels of ephrinb2 (0.63 ± 0.22), flt4 (0.60 ± 0.22), mrc1(0.74 ± 0.25), flk1(0.63 ± 0.20), and stabilin (0.54 ± 0.12) in gtpbp1latg morphants, which is normalized to wt controls. Values on the bottom right indicate the number of embryos exhibiting the staining pattern per total number. Data are mean ± S.D. *** p < 0.0001, ** p < 0.001, and * p < 0.05 according to unpaired Student’s t-test. Scale bars are 200 µm. |
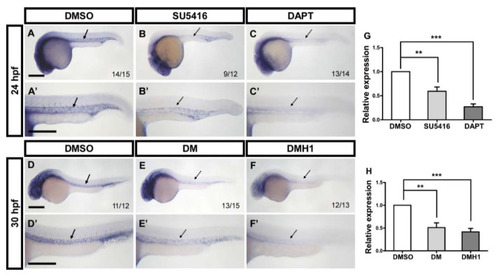
Interactions among gtpbp1l, VEGF/Notch, and BMP signals. (A–C) At 24 hpf, the expression level of gtpbp1l was decreased in SU5416-treated (B) and DAPT-treated embryos (C) compared to DMSO-treated control embryos. (D–F) At 30 hpf, inhibition of BMP signals by DM or DMH1 treatment reduced the expression of gtpbp1l in embryos compared with that in DMSO-treated control embryos. (A’–F’) Enlargements of (A–F). (G) The relative expression level was quantified by the qPCR assay and showed a significantly decreased expression of gtpbp1l in SU5416-treated (0.59 ± 0.23) and DAPT-treated (0.27 ± 0.12) embryos compared to controls. (H) Quantification of the relative expression level by qPCR analysis in DM-treated (0.51 ± 0.23) and DMH1-treated (0.42 ± 0.19) embryos had the reduced expression of gtpbp1l, which is normalized to DMSO-treated controls. Values on the bottom right indicate the number of embryos exhibiting the phenotype per total number of embryos analyzed. Data are represented as means ± S.D. *** refers to p < 0.0001 and ** p < 0.001 by unpaired Student’s t-test. Scale bars are 200 µm. |

ZFIN is incorporating published figure images and captions as part of an ongoing project. Figures from some publications have not yet been curated, or are not available for display because of copyright restrictions. |