
Figure 6
- ID
- ZDB-IMAGE-221226-117
- Genes
- Publication
- Lo et al., 2022 - GTP-Binding Protein 1-Like (GTPBP1l) Regulates Vascular Patterning during Zebrafish Development
- All Figures
- Figures for Lo et al., 2022
|
Figure 6
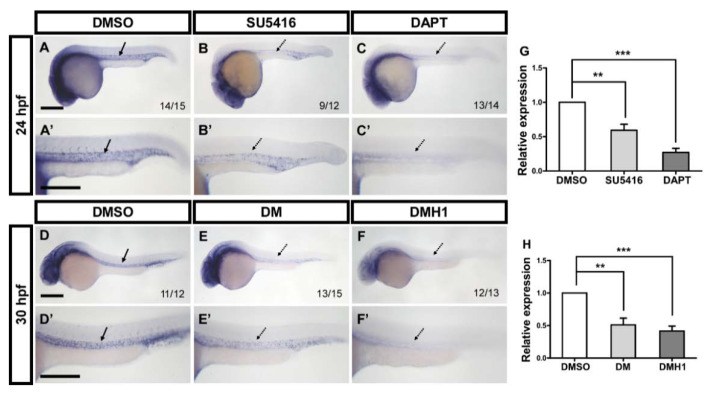
Interactions among gtpbp1l, VEGF/Notch, and BMP signals. (A–C) At 24 hpf, the expression level of gtpbp1l was decreased in SU5416-treated (B) and DAPT-treated embryos (C) compared to DMSO-treated control embryos. (D–F) At 30 hpf, inhibition of BMP signals by DM or DMH1 treatment reduced the expression of gtpbp1l in embryos compared with that in DMSO-treated control embryos. (A’–F’) Enlargements of (A–F). (G) The relative expression level was quantified by the qPCR assay and showed a significantly decreased expression of gtpbp1l in SU5416-treated (0.59 ± 0.23) and DAPT-treated (0.27 ± 0.12) embryos compared to controls. (H) Quantification of the relative expression level by qPCR analysis in DM-treated (0.51 ± 0.23) and DMH1-treated (0.42 ± 0.19) embryos had the reduced expression of gtpbp1l, which is normalized to DMSO-treated controls. Values on the bottom right indicate the number of embryos exhibiting the phenotype per total number of embryos analyzed. Data are represented as means ± S.D. *** refers to p < 0.0001 and ** p < 0.001 by unpaired Student’s t-test. Scale bars are 200 µm.