
- Title
-
Discovery of 1-Benzhydryl-Piperazine-Based HDAC Inhibitors with Anti-Breast Cancer Activity: Synthesis, Molecular Modeling, In Vitro and In Vivo Biological Evaluation
- Authors
- Ruzic, D., Ellinger, B., Djokovic, N., Santibanez, J.F., Gul, S., Beljkas, M., Djuric, A., Ganesan, A., Pavic, A., Srdic-Rajic, T., Petkovic, M., Nikolic, K.
- Source
- Full text @ Pharmaceutics

The general pharmacophore model for HDAC inhibitors (A) and chemical structures of five FDA-approved HDAC inhibitors (B). |
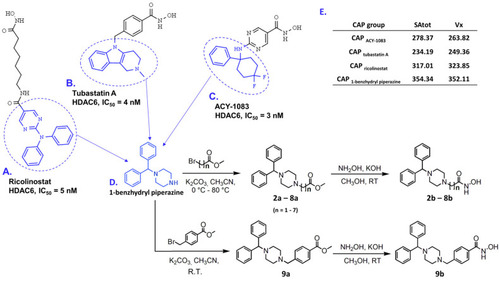
Examples of selective HDAC6 inhibitors: (A) ricolinostat, (B) tubastatin A, and (C) ACY-1083, in which CAP groups are labeled in blue; (D) synthetic routes to produce final products 2b–9b starting from 1-benzhydryl piperazine (CAP group) are presented on the bottom right corner, in which n represents the number of carbon atoms in the hydrocarbon linker; (E) table with calculated SAtot and Vx descriptors for selected CAP groups and 1-benzhydryl piperazine as a template, presented in the right upper corner. |

Predicted binding modes of superimposed 6b (green sticks, (A)) and 9b (magenta sticks, (A)), 7b (cyan sticks, (B)), and 8b (yellow and salmon sticks, (C)) in complex with CD2 HDAC6. Interacting amino acid residues from L1 and L2 pockets are represented by green sticks; the co-crystal TSA ligand is presented as black lines. |

Newly synthesized HDAC inhibitors activate the intrinsic cell death pathway. The proportion of early apoptotic and late apoptotic MDA-MB-231 cells was measured using bivariate Annexin V/7AAD analysis by flow cytometry after the cells underwent treatment with tested compounds at IC50 concentration for (A) 24 h, (B) 48 h, and (C) 72 h. (D) Dissipation of mitochondrial membrane potential was assessed by flow cytometry using JC-1 dye (compared to the untreated control). Significant differences between treatments were determined by t-test: * p ≤ 0.05, ** p ≤ 0.01, *** p ≤ 0.001 (compared to the untreated control). |
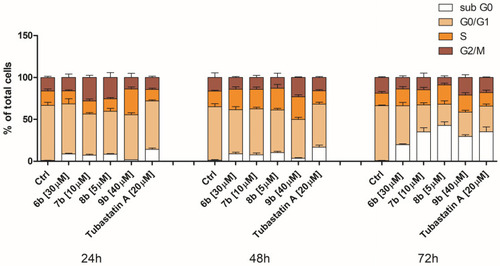
Changes in cell cycle phase distribution of MDA-MB-231 cells upon treatment with compounds 6b, 7b, 8b, 9b, and tubastatin A. After the 24 h, 48 h, and 72 h continual treatment of MDA-MB-231 cells with investigated compounds at IC50, as well as tubastatin A at IC50 and 20 μM, cells were stained with propidium iodide and analyzed by flow cytometry. White bar—apoptotic cells with DNA content corresponding to sub-G1 fraction; sandy bar—cells with DNA content corresponding to G0/G1 phases; orange bar—cells with DNA content corresponding to S phase; maroon bar—cells with DNA content corresponding to G2/M phases (compared to the untreated control). |
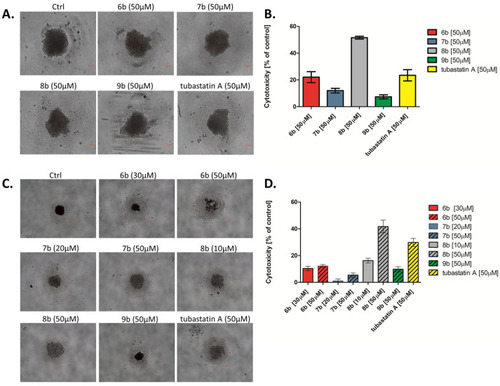
Inhibition of cell survival and growth of MDA-MB-231 tumor spheres treated with synthesized compounds. After 4 d, formed spheres were treated with synthesized compounds and tubastatin A at equimolar concentration (50 μM) for 72 h. The formation and growth of tumor spheres were examined and imaged with an Olympus CKX53, using 4×/0.13 and 10×/0.25 objectives. Scale bar: 100 μm. (A) MDA-MB-231 tumor spheres observed under the bright field, and (B) the cytotoxicity of compounds toward the MDA-MB-231 tumor spheres was investigated by MTT assay. (C) MDA-MB-231 cells were co-cultured with the tested compounds (IC50 and 50 µM) in sphere culture conditions for 4 d. The formation and growth of tumor spheres were examined and imaged with an Olympus CKX53, using a 4×/0.4 objective. Scale bar: 200 μm. (D) The cytotoxicity of compounds in the co-treatment with MDA-MB-231 tumor spheres was investigated by MTT assay. |

Compound 8b inhibits migration and invasion of MDA-MB-231 cells (A). MDA-MB-231 cells were subjected to bicameral migration (blue) and invasion (purple) assay. Cells were treated with 5 μM of 8b and 10 μM of 9b for 24 h. Cells in the bottom of the 8 mm pore membrane were fixed and quantified. Microphotographs show crystal-violet-stained migratory and invasive cells (B). Magnification 40×, scale bar = 50 μm. Representative results from three independent experiments are shown. Significant difference between treatments was determined by t-test: ** p < 0.01. |
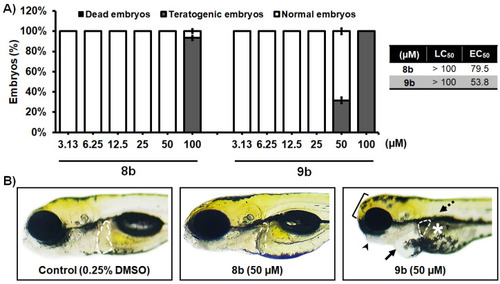
In vivo toxicity assessment of 1-benzhydryl-piperazine-based HDAC inhibitors 8b and 9b in the zebrafish (Danio rerio) model. (A) Acute toxicity was assessed using wild type (AB) embryos exposed to different doses of tested molecules, and expressed as the LC50 and EC50 doses. Embryos were treated at 6 h post fertilization (hpf), and evaluated for survival, teratogenicity, cardiotoxicity, and hepatotoxicity at 120 hpf (n = 60 per a dose). (B) Embryos exposed to 50 µM of 8b were normally developed embryos, without signs of cardiotoxicity, hepatotoxicity, and teratogenicity. On the other hand, treatment with 9b in some embryos provoked pericardial edema (arrow), weakly resorbed yolk (asterisk), malformed head (bracket) and jaw (arrowhead), no inflated swim bladder (dashed arrow), and decreased and dark liver (outlined). No adverse effect on the liver was detected at 50 µM of 8b, while reduced liver size and darkening (necrosis) occurred in embryos exposed to 50 µM of 9b. |
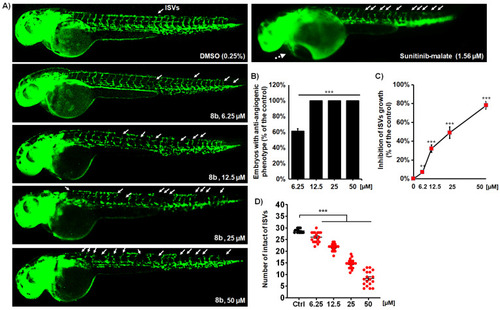
Compound 8b effectively inhibits angiogenesis in Tg(fli1:EGFP) zebrafish embryos with fluorescently labeled endothelial cells. Embryos were exposed to the four doses of 8b and assessed the inhibition of ISV vasculature at 48 hpf (A). Treatment with 8b increased the number of embryos with the anti-angiogenic phenotype (B), decreased the number of normally developed ISVs (C), and reduced the ISV length (D) in the dose-dependent manner. Sunitinib-malate (Suten), a clinically approved anti-angiogenic drug, was used as a positive control. While the Suten caused life-threating cardiotoxicity at the effective dose of 1.56 µM, 8b inhibited angiogenesis without any toxic response in the treated embryos. Representative images of embryos are shown. Data are normalized in relation to the control group (B,C). Significance in the analyzed parameters between 8b-treated embryos and control (DMSO-treated) embryos is indicated with asterisks (** p < 0.01; *** p < 0.001). |
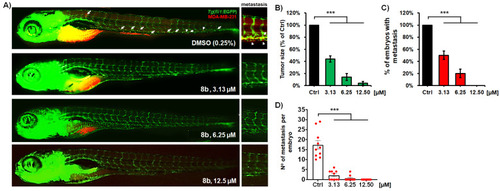
Anti-cancer and anti-metastatic activity of a new HDAC inhibitor 8b against highly metastatic human breast carcinoma MDA-MB-231 cells in zebrafish xenografts. Tg(fli1:EGFP) xenografts (n = 20) were exposed to three different doses of 8b, and analyzed for tumor progression and metastasis after 3-day treatment. Representative fluorescent microscopy images are shown (A); white arrows indicate disseminated cells. The applied treatments markedly reduced the MDA-MB-231 tumor growth (B), number of embryos with metastasis (C), as well as the number of disseminated cancer cells per xenograft (D), as compared to those in the control group (p < 0.001, for all hallmarks). Data are normalized in relation to the control group ((B–D) *** p < 0.001). |