
- Title
-
Synapsin III Regulates Dopaminergic Neuron Development in Vertebrates
- Authors
- Faustini, G., Longhena, F., Muscò, A., Bono, F., Parrella, E., La Via, L., Barbon, A., Pizzi, M., Onofri, F., Benfenati, F., Missale, C., Memo, M., Zizioli, D., Bellucci, A.
- Source
- Full text @ Cells

Phenotypic alterations in Syn III-MO-injected zebrafish. (A) Representative images of ST-MO- or Syn III-MO-injected embryos at 24 and 48 hpf. Syn III-MO-injected morphants exhibited mild or severe phenotype at 48 hpf. Scale bar, 500 μm. Abbreviations: mb, midbrain; hb, hindbrain; mhb, midbrain hindbrain boundary. (B) Ascending doses (in pmol/embryos) of Syn III-MO produced significant progressive increase in the percentage of dead embryos that was comparable in ST-MO and control non-injected (NI) embryos. (* p < 0.05, ** p < 0.01, *** p < 0.001, **** p < 0.0001 One-way ANOVA + Newman-Keuls, n = 3 experimental replicates represent the % mean of dead embryos per group from three experiments including at least 20 embryos per group). (C) Acridine orange fluorescence intensity (in arbitrary units) in the embryos injected with 1.0 pmol/embryo of ST-MO or Syn III-MO when compared to NI embryos at 24 and 48 hpf (One-way ANOVA + Newman-Keuls. n = 4 experimental replicates represent the mean fluorescence intensity per group in four experiments including at least 10 embryos per group). (D) At 48 hpf a significantly higher percentage of syn3 KD morphants exhibited mild the phenotype (**** p < 0.0001; one-way ANOVA + Newman-Keuls, n = 3 experimental replicates represent the % mean of embryos with phenotypic alterations per group from three experiments including at least 20 embryos per experimental condition). (E) At 48 hpf, a significantly higher percentage of mild and severe Syn III-MO-injected morphants exhibited head malformations, hyperactive movements, and heartbeat. Anteroposterior axis alterations frequency was significantly increased in the severe phenotype vs. mild phenotype syn3 KD morphants (**** p < 0.0001, ** p < 0.05, one-way ANOVA + Newman-Keuls, n = 3 experimental replicates represent the % mean of embryos with phenotypic alterations per group from three experiments including at least 20 embryos per experimental condition). |
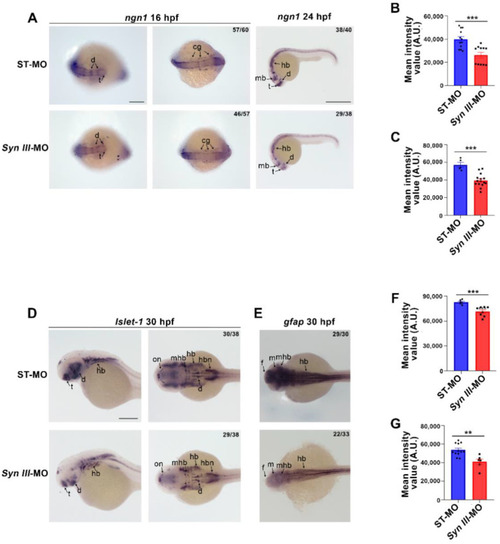
Expression of ngn1, Islet-1 and gfap is reduced in Syn III-MO injected embryos. (A) Representative images of ST-MO and Syn III-MO-injected zebrafish embryos hybridized with ngn1 at 16 hpf and 24 hpf. Abbreviations: mb: midbrain, hb, hindbrain; cg, cranial ganglia; t, telencephalon; d, diencephalon. 16 hpf scale bar, 200 μm; 24 hpf scale bar, 500 μm. (B,C) Quantification of ngn1 signal at 16 hpf (B) and 24 hpf (C) as mean intensity values in arbitrary units (A.U.). Syn III-MO-injected embryos showed a significant decrease in the mean intensity value when compared to control embryos (*** p < 0.001, unpaired Student’s t-test, n = 12 embryos per group). (D,E) Representative images showing 30 hpf embryos hybridized with Islet-1 (D) and gfap (E), scale bar = 200 μm for all the panels. Abbreviations: d, diencephalon; f: forebrain; hb, hindbrain; hbn, hindbrain neurons; mhb, midbrain hindbrain boundary; mb, midbrain; on, optic nerve; t, telencephalon. (F,G) Quantification of Islet-1 (F) and gfap (G) signal expressed as mean intensity values. Syn III-MO-injected embryos exhibited a significant decrease of both Islet-1 ((F), *** p < 0.001 unpaired Student’s t-test) and gfap when compared to control embryos ((G), ** p < 0.01, unpaired Student’s t-test). n = 6–15 embryos per group). EXPRESSION / LABELING:
PHENOTYPE:
|
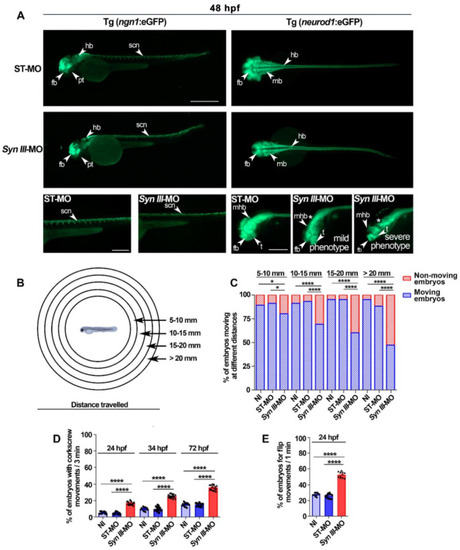
Syn III-MO injection affects Tg(ngn1:eGFP) and Tg(neurod1:eGFP) embryos neurodevelopment and behavior. (A) Representative lateral (left panels) and dorsal (right panels) views of ngn1 and neurod1 dependent eGFP fluorescence in the 48 hpf ST-MO- or Syn III-MO-injected Tg(ngn1:eGFP) and Tg(neurod1:eGFP) embryos, respectively. Full lateral/dorsal view scale bar, 500 μm. Tail/head magnifications scale bars = 250 μm. Asterisk indicates the midbrain/hindbrain regions exhibiting a clear reduction of the eGFP signal in the morphants. Abbreviations: fb, forebrain; hb, hindbrain, mb: midbrain; mhb, midbrain hindbrain boundary; t, telencephalon; pt, posterior tuberculum; scn, spinal cord neurons. (B) Schematic representation of the touch-evoked test. (C) Swimming performance of embryos at 72 hpf in the touch-evoked test. A significant progressive decrease in the % of syn3 KD morphants when compared to NI or ST-MO-injected embryos was detected (* p < 0.05, **** p < 0.0001, one-way ANOVA + Newman-Keuls, results are representative of three independent experiments with 40 embryos per group). (D) A significant increase in the percent of Syn III-MO-injected embryos exhibited corkscrew movement when compared to NI or ST-MO-injected embryos was observed at 24, 48 or 72 hpf (**** p < 0.0001, one-way ANOVA + Newman-Keuls, results are representative of three independent experiments with ≅ 10 embryos per group). (E) A significant increase in flipping movement was observed in the Syn III-MO-injected embryos when compared to NI or ST-MO-injected ones at 24 hpf (**** p < 0.0001, one-way ANOVA + Newman-Keuls, results are representative of three independent experiments with 10 embryos per group). EXPRESSION / LABELING:
PHENOTYPE:
|
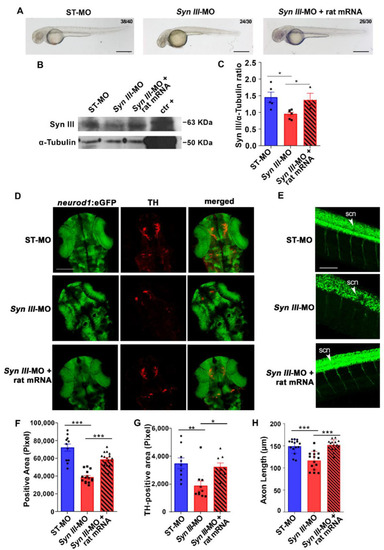
The neurodevelopmental deficits rescued by rat Syn III mRNA expression of Syn III-MO-injected Tg(neurod1:eGFP) embryos involve TH-positive dopaminergic neurons. (A) Representative images showing embryos injected with non-silencing ST-MO, Syn III-MO or Syn III-MO and rat mRNA (Syn III-MO + rat mRNA). Scale bars, 100 μm. (B) Representative WB from protein extracts of ST-MO-, Syn III-MO- or Syn III-MO + rat mRNA-injected Tg(neurod1:eGFP) embryos. The positive control is a protein extract obtained from the striatum of twelve-month-old C57BL/6J wt mice. Alpha-Tubulin bands are representative of the equal loading of samples. (C) Graphs show the ratio between the optical density (o.d.) of Syn III and α-Tubulin of ST-MO, Syn III-MO, and Syn III-MO + rat mRNA-injected Tg(neurod1:eGFP) embryos. Syn III was significantly reduced in the embryos exposed to syn3 KD when compared to either control or Syn III-MO + rat mRNA (* p < 0.05, One-way Anova + Newman-Keuls, n = 5 zebrafish protein pools per experimental condition). (D) Representative images showing TH immunostaining on 48 hpf Tg(neurod1:eGFP) embryos injected with ST-MO, Syn III-MO, or Syn III-MO + rat mRNA. Scale bar, 200 μm. (E) Representative images showing lateral spinal cord views of 48 hpf Tg(neurod1:eGFP) embryos injected with ST-MO, Syn III-MO, or Syn III-MO + rat mRNA. Scale bar, 200 μm. Abbreviations: scn, spinal cord neurons. (F) Quantification of the eGFP-positive area in the diencephalon. *** p < 0.001, one-way ANOVA + Newman-Keuls. n = 11–15 zebrafish embryos per group. (G) Graph shows the TH-immunopositive area (in pixel) of the 48 hpf Tg(neurod1:eGFP) embryos injected with ST-MO, Syn III-MO, or Syn III-MO + rat mRNA. Rat Syn III expression rescued the developmental deficits of TH-positive neurons in syn3 KD embryos (** p < 0.01, * p < 0.05; One-way ANOVA + Newman-Keuls. n = 8–10 zebrafish embryos per experimental condition). (H) Graph shows the spinal cord neuron axon length (in µm) of ST-MO-, Syn III-MO- or Syn III-MO + rat mRNA-injected Tg(neurod1:eGFP) embryos at 48 hpf. Injection of rat Syn III rescued the reduction in spinal neurons axonal length in syn3 KD embryos (*** p < 0.001 Syn III-MO or Syn III-MO + rat mRNA vs. control. One-way ANOVA + Newman-Keuls. n = 15 zebrafish per group). |
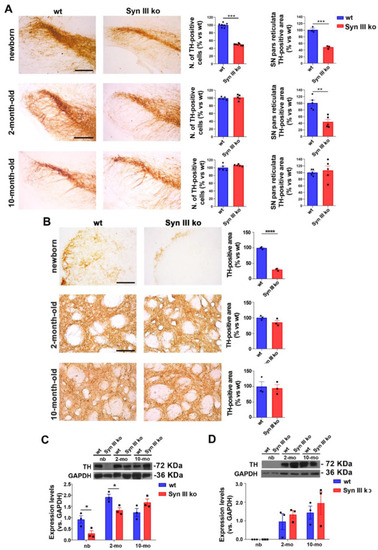
Reduction of nigrostriatal neurons development in newborn Syn III ko mice is progressively recovered in adult mice. (A) Graphs show the percent changes in SN TH-positive cell numbers of Syn III ko vs. wt mice evaluated by stereology at 0, 2 and 10 months of age. Newborn mice exhibited a significant reduction of TH-positive neurons (*** p < 0.001, unpaired Student’s t-test, n = 7 per group). The analysis of TH-immunopositive area in the pr of wt and Syn III ko mice (as percent change vs. age-matched wt mice) showed that the absence of Syn III reduced this parameter in both newborn and 2-month-old mice (*** p < 0.001, ** p < 0.01, unpaired Student’s t-test, n = 3–5 animals per group). Scale bar newborn mice: 100 μm; scale bar 2 and 10 month-old mice: 150 μm. (B) Representative images showing striatal TH-positive fibers of newborn, 2-month- or 10-month-old wt and Syn III ko animals. Graphs show the percent changes in the striatal TH-positive area in the Syn III ko mice vs. wt mice (**** p < 0.0001, unpaired Student’s t-test, n = 3 animals per group). Scale bar newborn mice: 120 μm; scale bar 2 and 10 month-old mice: 200 μm. (C) Representative images showing TH-immunopositive bands from WB analysis of Syn III ko or wt mouse midbrain protein extracts. Graph shows that TH levels were significantly reduced in the midbrain of newborn (nb) and 2-month-old Syn III ko mice when compared to wt littermates. No difference in TH levels was observed at 10 months of age. Data expressed as TH protein levels normalized vs. GAPDH expression (* p < 0.05, two-way ANOVA + Bonferroni’s post-test, n = 3 animals per group). (D) WB of striatal protein extracts from Syn III ko and wt mice showed that TH protein levels did not exhibit significant changes at 0 (nb), 2 and 10 months of age. Two-way ANOVA + Bonferroni’s post-test (n = 3 animals per group). |
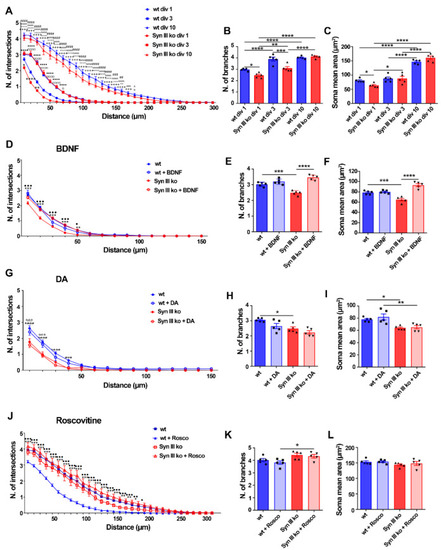
Syn III ko TH-positive mesencephalic neurons exhibit neurodevelopmental deficits involving BDNF and Cdk5 signaling. (A,D,G,J) Sholl analysis assessing the number of intersections. (A) A significant decrease in the number of intersections between the neuronal projections of primary midbrain TH-positive cells and concentric circles in div 1 Syn III ko neurons when compared to wt neurons (**** p < 0.0001, ** p < 0.01, * p < 0.05). A significant increase in the number of intersections was observed in div 10 when compared to div 3 (^ p < 0.05, ^^^ p < 0.001, ^^^^ p < 0.0001) or div 1 wt neurons (+ p < 0.05, +++ p < 0.001, ++++ p < 0.0001) as well as in div 10 to when compared to div 3 (## p < 0.01, ### p < 0.001, #### p < 0.0001) or div 1 Syn III ko neurons (°° p < 0.01, °°° p < 0.001, °°°° p < 0.0001). In Syn III ko neurons a significant increase in the number of intersections at div 3 when compared to div 1 neurons was also detected (■■■■ p < 0.0001, □ p < 0.05, □□□□ p < 0.0001, in wt neurons). (D) Sholl analysis showed that BDNF treatment restored the reduction in the number of intersections in Syn III ko but not in the wt TH-positive cells (*** p < 0.001, ** p < 0.01, Syn III ko vs. wt untreated neurons and ••• p < 0.001, • p < 0.05, untreated vs. treated Syn III ko neurons. (G) DA treatment was not effective in improving the number of intersections in Syn III ko TH-positive cells (*** p < 0.001 and **** p < 0.0001 vs. wt untreated neurons and °°° p < 0.001, vs. wt neurons. (J) Roscovitine treatment reduced number of intersections of wt TH-positive cells, but not that of Syn III ko neurons (*** p < 0.001, ** p < 0.01, * p < 0.05, untreated vs. treated wt neurons and ••• p < 0.001, •• p < 0.01, • p < 0.05, wt vs. Syn III ko neurons. Two-way ANOVA + Bonferroni’s post-test). n = 5 means that plotted values are the mean values deriving from five experiments analyzing 30 TH-positive cells from primary midbrain neuronal cells cultures of either Syn III ko or wt mice. (B,C) TH-positive-neurons from Syn III ko showed a significant reduction in the number of branches stemming from the primary midbrain neuronal cell bodies at div1 (* p < 0.05) and div 3 (*** p < 0.001) when compared to wt mice. A significant decrease of the mean soma area of TH-positive primary midbrain neurons in div 1 Syn III ko when compared to wt cells was detected (* p < 0.05). One-way ANOVA + Newman-Keuls multiple comparison test). n = 5 means that plotted values are the mean values deriving from five experiments analyzing 30 TH-positive cells from primary midbrain neuronal cultures of Syn III ko or wt mice (**** p < 0.0001, ** p < 0.01). (E,F) BDNF treatment also recovered the reduction in the number of branches and mean soma area of Syn III ko neurons (*** p < 0.001, Syn III ko vs. wt untreated neurons, **** p < 0.0001, untreated vs. treated Syn III ko neurons. One-way ANOVA + Newman-Keuls post-test n = 5 means that plotted values are the mean values deriving from five experiments analyzing 30 TH-positive cells from primary midbrain neuronal cells cultures of either Syn III ko or wt mice. (H,I) DA treatment did not either improve the branching or mean soma are of the TH-positive midbrain neurons from Syn III ko mice (* p < 0.05, Syn III ko vs. wt untreated neurons, ** p < 0.01, Syn III ko vs. wt DA-treated neurons, one-way ANOVA + Newman-Keuls). (K,L) The treatment of div 3 primary mouse midbrain neurons with Roscovitine for 24 h did not affect the number of branches and the mean soma area of wt and Syn III ko neurons (* p < 0.05). One-way ANOVA + Newman-Keuls multiple comparison test. n = 5 means that plotted values are the mean values deriving from five experiments analyzing 30 TH-positive cells from primary midbrain neuronal cultures of Syn III ko or wt mice. |
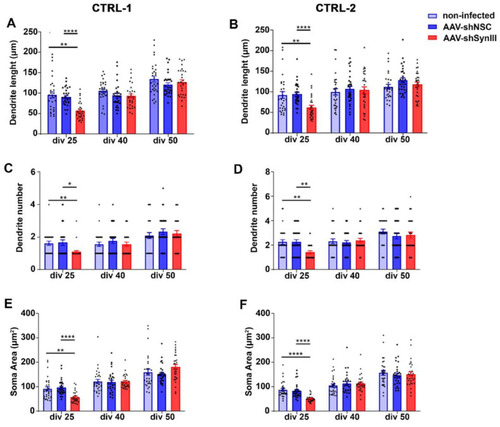
AAV-mediated Syn III RNAi impaired early iPSCs-derived mDN development. (A,B) Graphs show primary dendrite length analysis (expressed in µm) in control non-infected AAV-shSynIII- or AAV-shNSC-infected mDN produced from CTRL-1 (A) and CTRL-2 (B) iPSCs clones at div 25, 40 and 50. At 25 div AAV-shSynIII-infected mDN showed a statistically significant decrease in primary dendrite length when compared to NI and AAV-shNSC-infected cells (** p < 0.01, **** p < 0.001; two-way ANOVA + Bonferroni’s post-test). No changes were observed at div 40 or 50. n = 30 cells per each experimental condition. (C,D) Graphs show dendrites number in control and AAV-shSynIII- or AAV-shNSC-infected mDN produced from CTRL-1 (C) and CTRL-2 (D) iPSCs clones at div 25, 40 and 50. A significant decrease in the number of dendrites at div 25 was observed in the AAV-shSynIII-infected mDN when compared to both control and AAV-shNSC-infected cells (* p < 0.05, ** p < 0.01; two-way ANOVA + Bonferroni’s post-test). No changes were observed at div 40 or 50. n = 30 cells per each condition. (E,F) Graphs show the analysis of soma area of mDN (expressed in µm2) from control and AAV-shSynIII- or AAV-shNSC-infected mDN produced from CTRL-1 (E) and CTRL-2 (F) iPSCs clones at div 25, 40 and 50. A significant decrease in the mean soma area was detected in the AAV-shSynIII-infected mDN at div 25 when compared to control (** p < 0.01 and **** p < 0.0001) or AAV-shNSC-infected cells (**** p < 0.0001). Two-way ANOVA + Bonferroni’s post-test). No changes were observed at div 40 or 50. n = 30 cells per each condition. |