
Figure 1
- ID
- ZDB-IMAGE-221214-31
- Publication
- Faustini et al., 2022 - Synapsin III Regulates Dopaminergic Neuron Development in Vertebrates
- All Figures
- Figures for Faustini et al., 2022
|
Figure 1
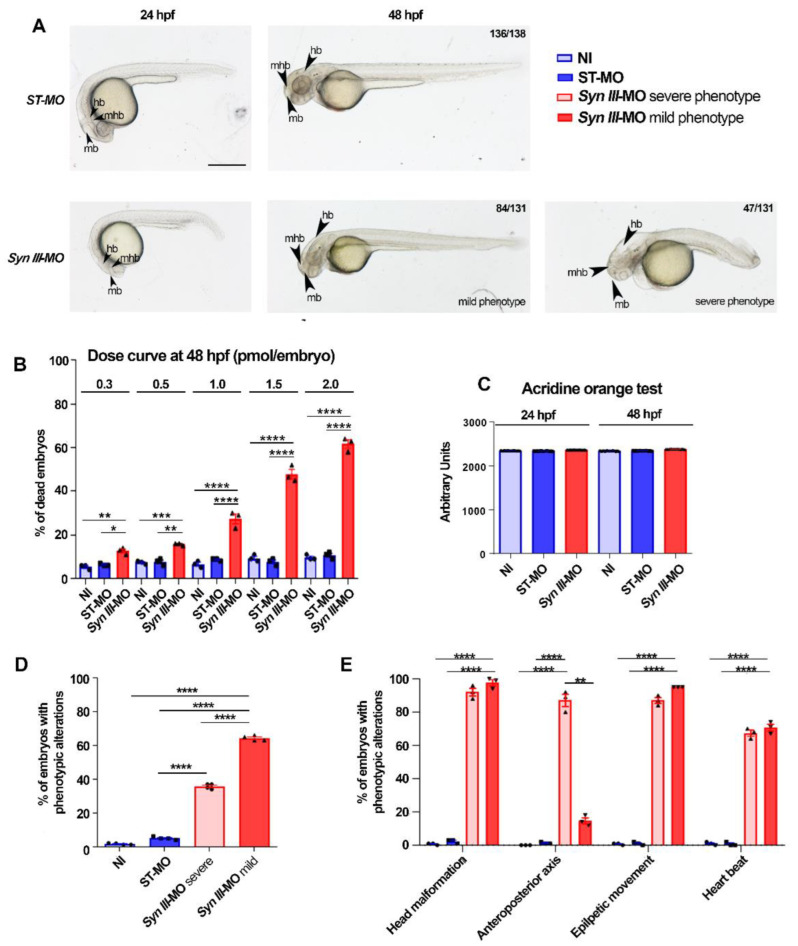
Phenotypic alterations in Syn III-MO-injected zebrafish. (A) Representative images of ST-MO- or Syn III-MO-injected embryos at 24 and 48 hpf. Syn III-MO-injected morphants exhibited mild or severe phenotype at 48 hpf. Scale bar, 500 μm. Abbreviations: mb, midbrain; hb, hindbrain; mhb, midbrain hindbrain boundary. (B) Ascending doses (in pmol/embryos) of Syn III-MO produced significant progressive increase in the percentage of dead embryos that was comparable in ST-MO and control non-injected (NI) embryos. (* p < 0.05, ** p < 0.01, *** p < 0.001, **** p < 0.0001 One-way ANOVA + Newman-Keuls, n = 3 experimental replicates represent the % mean of dead embryos per group from three experiments including at least 20 embryos per group). (C) Acridine orange fluorescence intensity (in arbitrary units) in the embryos injected with 1.0 pmol/embryo of ST-MO or Syn III-MO when compared to NI embryos at 24 and 48 hpf (One-way ANOVA + Newman-Keuls. n = 4 experimental replicates represent the mean fluorescence intensity per group in four experiments including at least 10 embryos per group). (D) At 48 hpf a significantly higher percentage of syn3 KD morphants exhibited mild the phenotype (**** p < 0.0001; one-way ANOVA + Newman-Keuls, n = 3 experimental replicates represent the % mean of embryos with phenotypic alterations per group from three experiments including at least 20 embryos per experimental condition). (E) At 48 hpf, a significantly higher percentage of mild and severe Syn III-MO-injected morphants exhibited head malformations, hyperactive movements, and heartbeat. Anteroposterior axis alterations frequency was significantly increased in the severe phenotype vs. mild phenotype syn3 KD morphants (**** p < 0.0001, ** p < 0.05, one-way ANOVA + Newman-Keuls, n = 3 experimental replicates represent the % mean of embryos with phenotypic alterations per group from three experiments including at least 20 embryos per experimental condition).