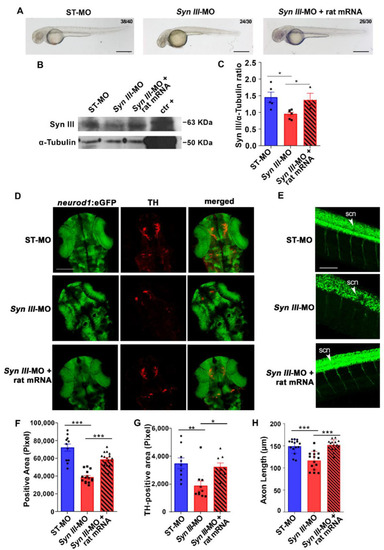
The neurodevelopmental deficits rescued by rat Syn III mRNA expression of Syn III-MO-injected Tg(neurod1:eGFP) embryos involve TH-positive dopaminergic neurons. (A) Representative images showing embryos injected with non-silencing ST-MO, Syn III-MO or Syn III-MO and rat mRNA (Syn III-MO + rat mRNA). Scale bars, 100 μm. (B) Representative WB from protein extracts of ST-MO-, Syn III-MO- or Syn III-MO + rat mRNA-injected Tg(neurod1:eGFP) embryos. The positive control is a protein extract obtained from the striatum of twelve-month-old C57BL/6J wt mice. Alpha-Tubulin bands are representative of the equal loading of samples. (C) Graphs show the ratio between the optical density (o.d.) of Syn III and α-Tubulin of ST-MO, Syn III-MO, and Syn III-MO + rat mRNA-injected Tg(neurod1:eGFP) embryos. Syn III was significantly reduced in the embryos exposed to syn3 KD when compared to either control or Syn III-MO + rat mRNA (* p < 0.05, One-way Anova + Newman-Keuls, n = 5 zebrafish protein pools per experimental condition). (D) Representative images showing TH immunostaining on 48 hpf Tg(neurod1:eGFP) embryos injected with ST-MO, Syn III-MO, or Syn III-MO + rat mRNA. Scale bar, 200 μm. (E) Representative images showing lateral spinal cord views of 48 hpf Tg(neurod1:eGFP) embryos injected with ST-MO, Syn III-MO, or Syn III-MO + rat mRNA. Scale bar, 200 μm. Abbreviations: scn, spinal cord neurons. (F) Quantification of the eGFP-positive area in the diencephalon. *** p < 0.001, one-way ANOVA + Newman-Keuls. n = 11–15 zebrafish embryos per group. (G) Graph shows the TH-immunopositive area (in pixel) of the 48 hpf Tg(neurod1:eGFP) embryos injected with ST-MO, Syn III-MO, or Syn III-MO + rat mRNA. Rat Syn III expression rescued the developmental deficits of TH-positive neurons in syn3 KD embryos (** p < 0.01, * p < 0.05; One-way ANOVA + Newman-Keuls. n = 8–10 zebrafish embryos per experimental condition). (H) Graph shows the spinal cord neuron axon length (in µm) of ST-MO-, Syn III-MO- or Syn III-MO + rat mRNA-injected Tg(neurod1:eGFP) embryos at 48 hpf. Injection of rat Syn III rescued the reduction in spinal neurons axonal length in syn3 KD embryos (*** p < 0.001 Syn III-MO or Syn III-MO + rat mRNA vs. control. One-way ANOVA + Newman-Keuls. n = 15 zebrafish per group).