
- Title
-
Stability, Toxicity, and Antibacterial Potential of Gallic Acid-Loaded Graphene Oxide (GAGO) Against Methicillin-Resistant Staphylococcus aureus (MRSA) Strains
- Authors
- Shamsi, S., Abdul Ghafor, A.A.H., Norjoshukrudin, N.H., Ng, I.M.J., Abdullah, S.N.S., Sarchio, S.N.E., Md Yasin, F., Abd Gani, S., Mohd Desa, M.N.
- Source
- Full text @ Int. J. Nanomedicine
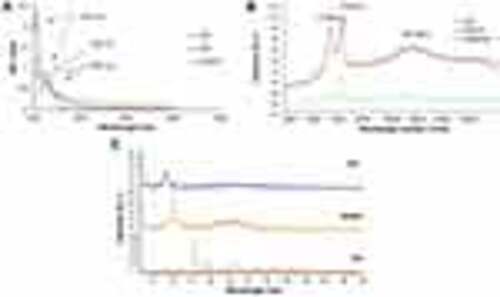
(A) UV-Vis absorbance spectra of GA, GO, and GAGO samples, (B) Raman spectra of GO, GAGO, and Gr obtained using 532 nm diode laser excitation. The G band is a result of in-plane vibrations of sp2 bonded carbon atoms, while the D band represents plane vibrations attributed to the presence of structural defects, (C) XRD patterns of GO, GAGO, and GA measured at 40 kV and 40 mA with a scanning rate of 5°/min and 2ϴ angles ranging from 5° to 60°. |
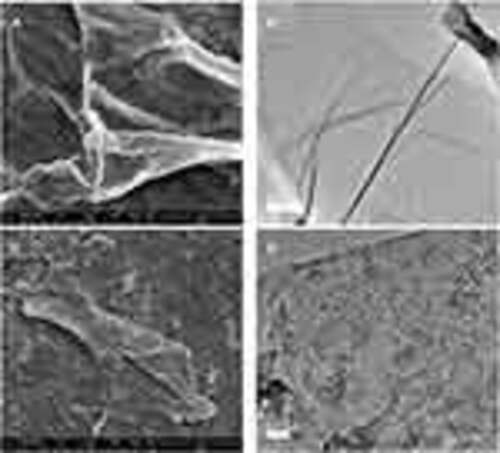
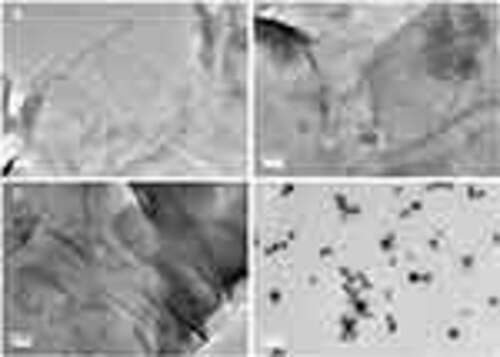
FESEM and TEM micrographs of (A) GO, (B) GO (TEM), (C) GAGO, and (D) GAGO (TEM) dispersed in distilled water at 1 mg/mL. The scale bars shown are 1 µM for FESEM, 500 nm (B), and 100 nm (E) for TEM. |
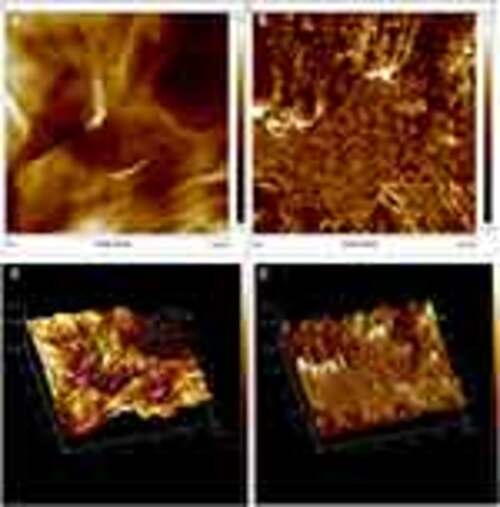
Characterization of the surface by 2D images of (A) GO and (B) GAGO as observed by AFM, and the 3D image analyses of (C) GO and (D) GAGO. |

In vitro release profile of GA from GAGO solution. 25 mg of GAGO was dispersed into 30 mL of PBS (pH = 7.4) at 37°C in a shaking water bath operating at 150 rpm. At predetermined time intervals over 24 h, 1 mL of sample was aliquoted from the medium, and the aliquoted sample was replaced with 1 mL of PBS to maintain the sink condition throughout the experiment. Data represents mean ± SD (n = 3). |
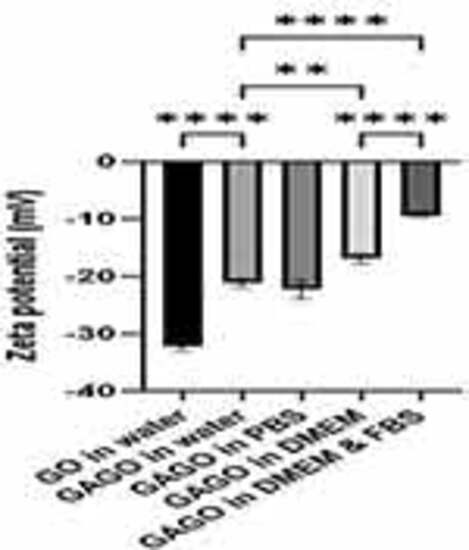
The zeta potential (mV) of GO and GAGO in four different physiological media. ** and ****Denotes the significant difference between the zeta potential of each sample with p < 0.01 and p < 0.001, respectively. |
TEM micrographs of (A) GAGO in water, (B) GAGO in PBS, (C) GAGO in DMEM, and (D) GAGO in DMEM with 10% FBS dispersed at 1 mg/mL at 100,000× magnification. Scale bars represent 200 nm. |
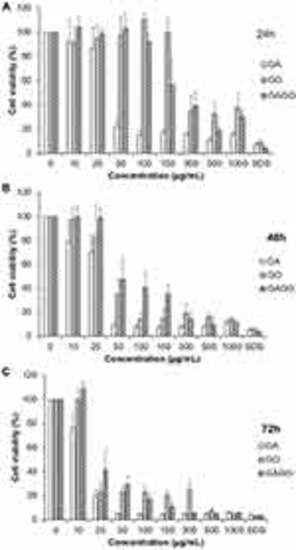
Cytotoxicity of GA, GO, and GAGO at concentrations of 0 to 1000 µg/mL against the 3T3 fibroblast cells at 24 h (A), 48 h (B), and 72 h (C). SDS 0.1% was used as a positive control. The viability of the cells was expressed as a percentage of the cells exposed to the appropriate medium, and the results were expressed as mean ± SD (n≥3). |
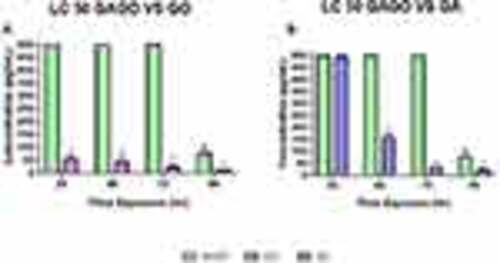
Lethal concentration at 50% (LC50). Lethal concentration at 50% (LC50) of zebrafish embryo for each timepoint of exposure (24, 48, 72 and 96 h) in (A) LC50 GAGO vs GO, (B) LC50 GAGO vs GA. Data were averaged from three independent experiments and are shown as mean ± SEM. Significant differences between experimental groups are denoted by “*” (Two-way ANOVA, followed by a post hoc test: Dunnet’s, p ≤ 0.05). |
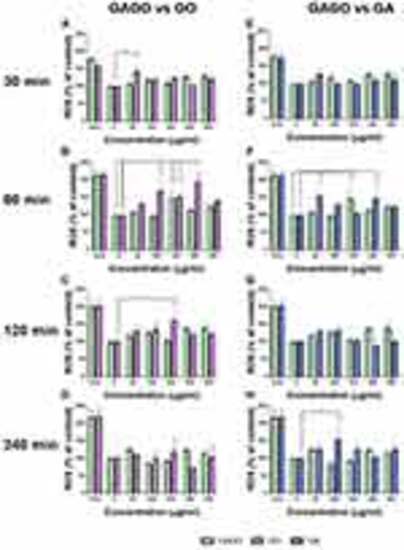
Reactive Oxygen Species content (ROS). This figure shows the ROS content on zebrafish embryos treated with GO, GA, and GAGO at four time points (30, 60, 120, and 240 min). (A–D) shows the comparison of ROS content between GAGO and GO, while (E–H) shows the comparison of ROS content between GAGO and GA. Significant differences between experimental groups are denoted by “*” (Two-way ANOVA, followed by a post hoc test: Dunnet’s, p ≤ 0.05). |
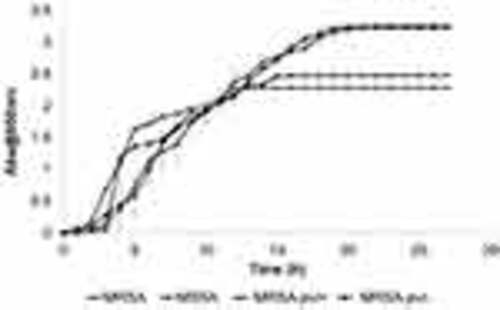
The growth curve of MRSA, MSSA, MRSA-pvl+, and MRSA-pvl-. Bacterial cultures were incubated on a shaking incubator at 120 rpm at 37°C throughout the experiment. Then, 1 mL of the bacterial culture was taken every hour for 28 h to measure the absorbance reading at 650 nm. The spent medium was replaced with a fresh MH broth. Data represent mean ± SD (n = 3). |
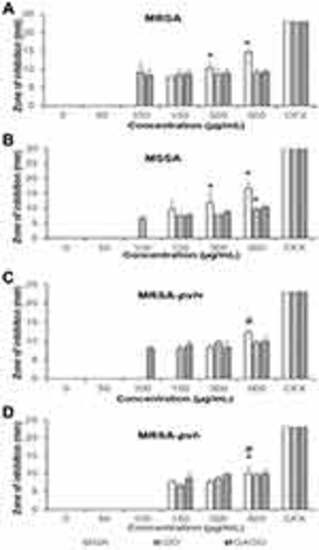
Zone inhibition of (A) MRSA, (B) MSSA, (C) MRSA-pvl+, and (D) MRSA-pvl- following exposure to GA, GO, and GAGO for 18 h at different concentrations (0-–500 µg/mL). MRSA, MSSA, MRSA-pvl+, and MRSA-pvl- treated with distilled water served as negative control (CTRL), while CFX acts as the positive control. Data represent mean ± SD (n = 3). Significant differences between experimental groups are denoted by *(Significant difference to 150 µg/mL) and #(Significant difference to 300 µg/mL; One-way ANOVA, followed by a post-hoc Tukey’s test, p ≤ 0.05). |
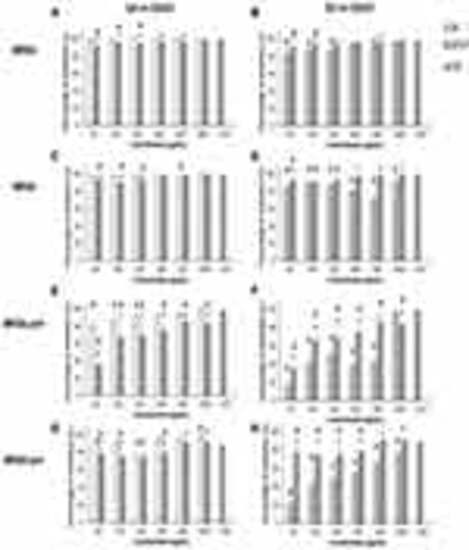
Percentage of inhibition of (A–B) MRSA, (C–D) MSSA, (E–F) MRSA-pvl+, and (G–H) MRSA-pvl- following exposure to GA, GO, and GAGO for 18 h at different concentrations (50–1000 µg/mL) compared to the positive control, CFX. Data represent mean ± SD (n = 3). Significant differences between experimental groups are denoted by * and #Denotes significant differences in CFX (One-way ANOVA, followed by a post-hoc Tukey’s test, p ≤ 0.05). |
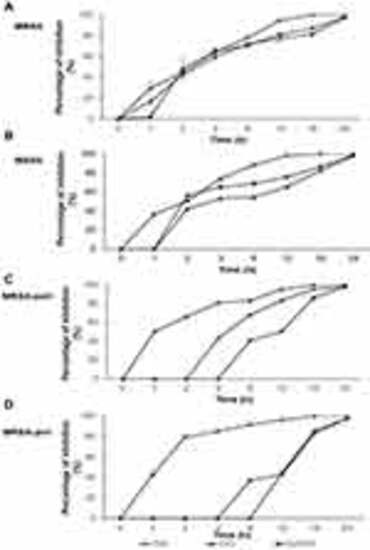
Percentage of inhibition of (A) MRSA, (B) MSSA, (C) MRSA-pvl+, and (D) MRSA-pvl- following exposure to GA, GO, and GAGO for 0–24 h at 150 µg/mL. Data represent mean ± SD (n = 3). |
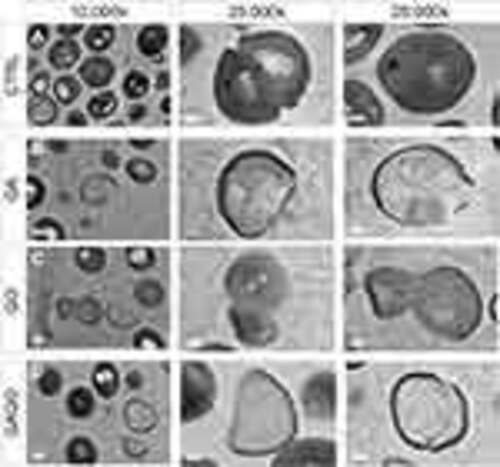
HRTEM micrographs of MRSA treated with (A) distilled water (CTRL), (B) GA, (C) GO, and (D) GAGO at 150 µg/mL for 12 h. Scale bars represent 200 nm (10,000× magnification) and 100 nm (25,000× magnification). Arrows indicate a compromised membrane with cell lysis, resulting in cytoplasm leakage and reduced cellular content. |
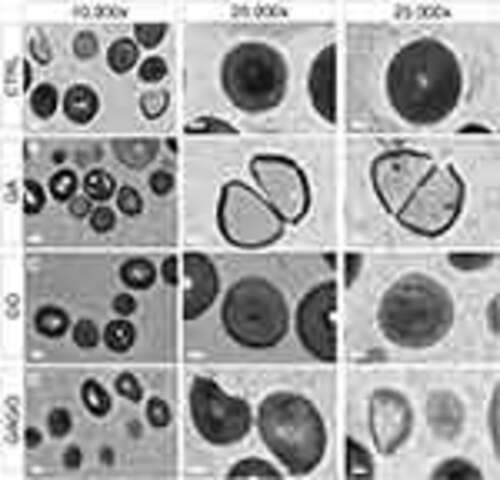
HRTEM micrographs of MSSA treated with (A) distilled water (CTRL), (B) GA, (C) GO, and (D) GAGO at 150 µg/mL for 12 h. Scale bars represent 200 nm (10,000× magnification) and 100 nm (25,000× magnification). Arrows indicate a compromised membrane with cell lysis, that results in cytoplasm leakage and reduced cellular content. |